Provincial Intelligence Hub
Mondulkiri, in full
Sourced information about the province. Every figure is tagged so you know how far to trust it. One filter runs the whole page: type a topic, a question, or the name of a district, commune or village. It ranks the topics by how much each is about what you typed — not whether the word happens to appear — answers outright if the dataset can compute it, and narrows the page to match. It knows that a dam is hydropower and a tribe is an indigenous people, and it filters by what a panel actually holds. All of it runs here in the page, with no network call.
Verified Area and elevation are from the Ministry of Interior’s Information Book on Capitals and Provinces of Cambodia (2024) and the provincial GIS contour layer.
Land and terrain
Mondulkiri is Cambodia's largest province by area, at 14,288 km² — and, at the same time, its smallest by population. That combination is what defines the landscape here: open hills, pine stands, and long stretches where the forest simply continues past the last village, rather than the dense, subdivided countryside typical of lowland Cambodia.
The terrain rises and falls across a genuine elevation range — from around 200 m in the lowlands to just over 1,000 m at Phnom Nam Lyr, the province's highest point. Sen Monorom, the provincial capital, sits at roughly 800 m, which is most of the reason its climate feels so different from the rest of the country.
Mondulkiri borders Kratié province to the west, Stung Treng and Ratanakiri to the north, and Vietnam's Đắk Nông and Đắk Lắk provinces to the east and south. The province's characteristic red basaltic soils — the same volcanic soil family that supports Vietnam's own Central Highlands coffee belt just across the border — are part of why coffee, rubber, and cashew all do well here.
New here? There is a three-minute walkthrough of this hub — captioned, with a full transcript — covering the source badges, the filter, the question box and the map layers.
Administrative Breakdown
Sen Monorom
The provincial capital and administrative seat — the only urban center in the province, and the seat of the Provincial Hall, Referral Hospital, and main commercial district.
Kaev Seima
Home to the Keo Seima Wildlife Sanctuary and much of the province's rubber concession land; borders Kratié province.
Kaoh Nheaek
The largest and most remote district, in the province's north — historically significant as a forced-relocation site under the Khmer Rouge, and still the least accessible by road.
O'Reang
Southwest of Sen Monorom, home to Dak Dam commune's community-based ecotourism circuit and pine-forest highlands.
Pech Chenda
Home to Bou Sra commune and Cambodia's best-known waterfall, on the province's eastern side toward the Vietnam border.
Province Total
17 communes (Khum), 4 quarters (Sangkat) within Sen Monorom, and 92 villages in total.
Administrative division counts as of 2024 · Source: Ministry of Interior records, via IntoCambodia.org
Official Provincial Profile
Straight from the Ministry of Interior's Information Book on Capitals and Provinces of Cambodia (15 March 2024) — the government's own reference profile for Mondulkiri. Where these figures differ from other sources on this site, both are shown rather than quietly reconciled.
Population, 1998 → 2019
The province has nearly tripled in twenty years — the steepest stretch was 1998–2008.
Ministry of Interior Information Book 2024, citing national censuses · Verified
Age structure
Over a third of the province is under 15 — a young population by any standard.
2019 census via MoI Information Book 2024 · Verified
Population by district
Kaev Seima holds nearly a third of the province's people.
2019 census, NIS · Verified
Land area by district
Note how completely this inverts the chart to its left — Kaoh Nheaek is 39% of the province but thinly settled, while the capital is tiny and dense.
Provincial Spatial Plan 2020–2040 (WWF, 2021), Table 1 · Verified
Population, by census
The province has nearly tripled in thirty years: 32,407 (1998) → 61,107 (2008) → 71,825 (2013) → 84,624 (2017) → 92,213 (2019). The 2019 census splits as 47,242 male and 44,971 female across 20,409 households, averaging 4.5 people per household, at a density of 7 people/km².
Ministry of Interior, Information Book on Capitals and Provinces of Cambodia, March 2024, p.109–110
A strikingly young province
35.0% of residents are aged 0–14 (32,275 people), 61.0% are 15–59 (56,250), and only 4.0% are 60 or older (3,688). That is a markedly younger age structure than Cambodia as a whole, and it shapes almost everything downstream — school demand, labour supply, and the kind of investment the province actually needs.
Ministry of Interior Information Book 2024, citing the 2019 census
How the province is governed
Two bodies run the province: a Provincial Council of 14 members and a Board of Governors made up of one Governor and ten Deputy Governors, supported by an administration director and five deputies. Beneath them sit 1 municipality and 4 districts, 17 communes and 4 sangkats, and 92 villages.
Ministry of Interior Information Book 2024, p.109
Rainfall and climate: sources disagree
The Ministry of Interior profile records average annual rainfall of 2,200 mm and a temperature range of 19°C to 33°C. Copernicus climate-averages data, used elsewhere on this site, gives roughly 1,970 mm. Both are shown because the gap is real and neither source explains it — if you need a defensible figure for planning or investment, use the government number and cite it as such.
MoI Information Book 2024 vs. Copernicus C3S climate averages
The Vietnam border, measured
Mondulkiri's international frontier with Vietnam runs about 314.66 km, facing Đắk Lắk and Bình Phước provinces to the east and south. Domestically it borders Kratié to the west, and Stung Treng and Ratanakiri to the north. Terrain is officially described as plateau, valley and mountain.
Ministry of Interior Information Book 2024, p.110
Soils — why things grow here
Three soil groups are recorded for the province: Labansiek, Dak Dam and Nam Lear. Labansiek in particular is the deep red basaltic soil that underpins the region's coffee, rubber, cashew and pepper — the same soil family that supports Vietnam's Central Highlands plantations immediately across the border.
Ministry of Interior Information Book 2024, p.110
District & Commune Explorer
Population by commune across the 1998, 2008 and 2019 censuses (National Institute of Statistics), plus land use and economic potential for each district. Two official 2019 population totals exist for this province — the NIS census count and a separate Commune Database/PDoP count — and they don't quite match; both are shown where relevant rather than picking one silently.
Names: one spelling here, and every other spelling you may meet
Cambodian place names have no single English transcription, and this province’s own documents use several. The site uses the Ministry of Planning register’s spelling throughout — in the prose, on the map labels and inside every hover readout — and lists the alternatives here so a document that says one thing can be matched to a page that says another. Three names are deliberately left alone: the town of Sen Monorom, Bou Sra waterfall, and Keo Seima Wildlife Sanctuary, which is a protected area rather than the district of Kaev Seima. Quotations keep their source’s spelling.
These are the same choice as the filter at the top of the Data Hub. Set it in either place and both follow.
Verified
The provincial capital and only urban center — 26.4 people/km², by far the densest division in the province. The Commune Database's separate 2019 count (14,252) runs slightly higher than the NIS census figure (13,195) shown below; both are official, from different collection methods.
| Sangkat | Pop. 1998 | Pop. 2008 | Pop. 2019 |
|---|---|---|---|
| Monourom | 897 | 1,469 | 1,764 |
| Rummeaknea | 1,570 | 3,108 | 3,007 |
| Sokhak Dom | 1,835 | 2,904 | 2,497 |
| Spean Mean Chey | 2,730 | 4,859 | 5,927 |
Land use & potential — Reported
Smallest agricultural footprint of any division (11,820 ha); dominated by mosaic forest-cropland (63%), mainly vegetables. Economically, this is the administrative, commercial and tourism-services hub — provincial government, hospital, hotels, guesthouses and NGO offices concentrate here, functioning as the base for trips to Bou Sra, the elephant sanctuaries and the coffee estates, even though those sites sit physically in other districts.
Verified
The most populous of the four true districts, at 9.0 people/km². Srae Khtum, the district seat, holds roughly 43% of the district's population on its own. The Commune Database's 2019 count (26,248) runs about 2,650 lower than the NIS census figure shown below.
| Commune | Pop. 1998 | Pop. 2008 | Pop. 2019 |
|---|---|---|---|
| Chong Phlah | 2,743 | 3,073 | 3,648 |
| Memang | 1,053 | 1,992 | 3,047 |
| Srae Chhuk | 1,808 | 3,342 | 5,830 |
| Srae Khtum (urban) | 2,551 | 9,238 | 12,498 |
| Srae Preah | 699 | 1,573 | 3,881 |
Land use & potential — Verified / Reported
Highest cropland share of any district — 61% of its 56,434 ha of agricultural land is cropland, plus 25% rubber — concentrated in the northeast and southeast near the Kratié border. Also home to most of Keo Seima Wildlife Sanctuary (233,654 ha within Mondulkiri, 16.3% of the province), which supports a WCS/USAID REDD+ forest-carbon program and the Jahoo Gibbon Camp ecotourism site. A 2024 Mongabay investigation alleged some Bunong villagers have lost forest access under the carbon-offset scheme — flagged here as an active, contested dispute rather than settled fact.
Verified
The province's largest district by far — 39% of its total territory — and its least densely populated, at roughly 4 people/km². Growth here (3.36%/year, 2009–2019) is the slowest of any district. A Buon Leu is the only commune province-wide whose population fell between 2008 and 2019; no confirmed cause was found for this in official sources.
| Commune | Pop. 1998 | Pop. 2008 | Pop. 2019 |
|---|---|---|---|
| A Buon Leu | 831 | 1,548 | 1,472 |
| Nang Khi Lik | 1,566 | 3,009 | 2,593 |
| Roya | 1,128 | 1,986 | 4,975 |
| Sokh San | 1,310 | 2,381 | 3,867 |
| Srae Huy | 843 | 1,531 | 2,446 |
| Srae Sangkum (urban) | 3,241 | 4,754 | 6,870 |
Land use & potential — Verified
The only district where paddy rice is a major land use (31% of its 51,933 ha of agricultural land), alongside rubber (48%) — reflecting lowland river-plain geography along the Srepok River. Overlaps with Srepok Wildlife Sanctuary (372,971 ha, the single largest protected area share in the province) and part of Lumphat Wildlife Sanctuary. Gold-bearing sandstone has been identified here. Least tourism-developed district based on available sourcing — a genuine data gap worth flagging rather than filling with guesses.
Verified
The smallest district by both area and commune count — just 2 communes. Note: one of them shares the name "Saen Meaknourum" with the provincial capital municipality, but is a separate rural commune inside Ou Reang — a genuine source of confusion worth flagging clearly to avoid mixing the two up.
| Commune | Pop. 1998 | Pop. 2008 | Pop. 2019 |
|---|---|---|---|
| Dak Dam | 1,007 | 1,472 | 2,077 |
| Saen Meaknourum (rural commune) | 1,466 | 2,476 | 4,568 |
Land use & potential — Verified / Reported
Mosaic forest-cropland dominates (56% of 16,042 ha agricultural land), mainly cassava. Functions as a border-trade and cross-border energy corridor — Dak Dam hosts the international crossing into Vietnam's Đắk Lắk/Đắk Nông provinces, and Cambodia imports roughly 2 MW of electricity through this point. Overlaps significantly with Phnom Prich Wildlife Sanctuary. Bauxite deposits (25–35% aluminum content) are found here — the only district identified for bauxite. Note the licence register has moved on: Alex Corporation's 36,005 ha block is now recorded Invalid, and live bauxite exploration rests with Alumina (Cambodia-Vietnam) at 27,277 ha (see Mining). Dak Dam's community-based ecotourism circuit is the district's main visitor draw.
Verified
The fastest-growing district in the province by far — 6.69%/year (2009–2019), more than double the slowest district. Home to the province's highest elevations, up to 1,030 m, near the Vietnam border.
| Commune | Pop. 1998 | Pop. 2008 | Pop. 2019 |
|---|---|---|---|
| Bu Sra | 2,425 | 3,704 | 6,288 |
| Krang Teh | 1,011 | 1,277 | 3,464 |
| Pu Chrey | 956 | 4,177 | 7,524 |
| Srae Ampum | 737 | 1,234 | 2,247 |
Land use & potential — Verified / Reported
Second-largest agricultural footprint (65,255 ha) — rubber (44%) and cropland (40%) dominate, concentrated in the southeast, which independent land-cover analysis flags as one of the province's four major deforestation-for-agriculture hotspots (1999–2019). Also home to Bou Sra Waterfall in Bu Sra commune, Cambodia's best-known waterfall and the province's flagship tourism asset, and to gold-bearing sandstone deposits. Fast growth plus an active deforestation hotspot makes this the most economically dynamic but also the most environmentally pressured district.
Down to village level: Lam Meh
Village-level data for Mondulkiri is almost never published. This is the exception — a Bunong community documented in detail because it received a communal land title under the World Bank-financed LASED III project. It is included as a concrete, verifiable picture of what one of the province's 92 villages actually looks like.
Who lives there
Lam Meh sits in Bu Sra commune, Pechreada district. It counts 813 families and 971 residents (507 male, 464 female), of whom 622 are adults. The community is recorded as 100% Indigenous — Bunong — with no other ethnic or religious group registered.
LASED III ESMP Cluster 9 (MLMUPC / MAFF, 25 Nov 2025), Table 1
The communal land title
Lam Meh's title covers 127 parcels totalling 2,532.29 ha — by far the largest of the seven communities titled under LASED III. It breaks down as 67.75 ha residential, 1,463.61 ha agricultural land, 990.96 ha of reserved/spirit forest, 6.86 ha and 3.11 ha in smaller categories. For comparison, the five Ratanakiri communities in the same cluster hold between 300 and 1,090 ha each.
LASED III ESMP Cluster 9, land parcel table, p.22
Getting there, and what's built
The village is 45 km from Sen Monorom, but only 1.5 km from its commune hall and about 1 km from the district hall. It has one access road in medium condition and a concrete road linking to National Road 78. Its kindergarten is an old wooden building funded by a Christian fund; its primary school has two buildings — one built by the rubber company Socfin, the other by the Ministry of Education.
LASED III ESMP Cluster 9, pp.14, 21
What is being funded now
Following title issuance, the community chose its own priorities through consultation. Lam Meh opted for 220 m of concrete road improvement plus agriculture and livelihood support — notably declining school, clinic and community-centre construction, because a June 2025 assessment found its existing facilities already adequate. Community consultation on the works took place in August 2025.
LASED III ESMP Cluster 9, subproject scope table, p.25
Second profile: Andoung Kraloeng
A Bunong community in Sen Monorom commune, Ou Reang district — 23 km from the provincial town, reached from National Road 76 beside the Keo Seima Wildlife Sanctuary office. Documented for the same reason as Lam Meh: it holds a communal land title under LASED III.
The community
202 households, 796 people (389 male, 407 female) across 1,424.26 ha. It is made up of five settlement groups — Pu Chuor, Pu Klare, Pu Phounh, Srae Yiev and Andoung Kraloeng — of which Srae Yiev is the most remote, poorly connected by road. The age split is young: 15% under 5, 13% aged 6–12, 14% aged 13–17, 58% adult.
LASED III ESMP — Andoung Kraloeng (MLMUPC/MAFF, Jan 2024), citing Commune Database 2021
Primary enrolment up fivefold — high school collapsing
Between 2010 and 2020, primary enrolment rose from 47 to 245. Over the same decade high-school enrolment fell from 33 to 14. The document names the cause: secondary and high school are ~10 km away, and the cost and distance of living away from home deters students — girls in particular. Literacy is ~100% for ages 15–17 but only 81.9% for 18–45, with a 23.1% illiteracy rate at 25–45.
LASED III ESMP — Andoung Kraloeng, §5
A health post that is mostly shut
The village has a health post beside the Pu Chu primary school, supervised by the Sen Monorom health centre — but residents report one nurse attends only two or three times a month, and the provincial health department confirms it stocks only a few diarrhoea and fever medicines. Recorded plainly here because the existence of a facility and access to care are not the same thing.
LASED III ESMP — Andoung Kraloeng, §6
Water, roads and what is being built
Five wells serve the village — four drilled (two solar-powered), one traditional well that dries up February to May. All households in Srae Yiev and Pu Klaer lack clean water access despite streams nearby. LASED III is funding 3,975 m of laterite road and one primary school with five classrooms. Existing stock: village hall, kindergarten, 3 primary schools (8 teachers), a library and the health post.
LASED III ESMP — Andoung Kraloeng, §§7–9, Table 2
Population by commune: NIS General Population Census 1998 / 2019, Final Results, via citypopulation.de. District area, land-use percentages and protected-area figures: PCLMUP of Mondul Kiri Province, Technical Report of the Mondul Kiri Provincial Spatial Plan 2020–2040 (WWF, 2021). A full list of all 92 village (phum) names was not located in official, machine-readable form during this research pass — the National Committee for Sub-National Democratic Development's commune database is the most likely source and is flagged here as a known gap rather than filled with invented names.
Demographics & Bunong Heritage
Who Lives Here
Indigenous communities — predominantly Bunong (also spelled Phnong) — make up a majority of the province's population, commonly cited around 54–60%, with the remainder Khmer, Chinese, and Cham Muslim communities concentrated mostly in and around Sen Monorom.
Provincial demographic overviews (IntoCambodia.org, Mondulkiri Project); precise current % not independently verified
Spirit Forests & Land Tenure
Bunong cosmology holds that mountains, water, animals, and forests carry spirits that must not be disrespected — certain sacred pockets of wilderness ("spirit forests") are never cut. Traditionally, land was never held individually; the forest was considered a shared resource. The slow rollout of collective land title registration has left much community land legally unallocated and vulnerable to concessions.
Mondulkiri Project; Diakonia; Southeast Asia Globe
Swidden Agriculture
Most Bunong families historically practiced swidden (shifting) cultivation — clearing and burning forest plots for hill rice intercropped with vegetables, using a single site for up to 5 years within a traditional 15–20 year rotation cycle before it's left to regenerate.
Mondulkiri Project field documentation
The Elephant Tradition
Bunong families have tamed and lived alongside elephants for over a century, treating them as family members — eating elephant meat is taboo, and a sick or injured elephant is treated with ceremony. Elephant ownership once signified family wealth and status. The Khmer Rouge era, when Bunong communities were forcibly relocated to Kaoh Nheaek, killed or scattered most of the province's domesticated herd; roughly 36 domesticated elephants are believed to remain province-wide today.
Bunong Elephant Project; Elephant Valley Project; Southeast Asia Backpacker
Four figures for 2019, and a fifth that replaces them all
This Atlas already prints two counts for 2019 and says they disagree. That was right and it was incomplete. The 2019 census final report, published in September 2025, carries three figures of its own, and this page was already drawing one of them on a chart without saying it was the same census.
| Figure | What it counts | Source |
|---|---|---|
| 88,649 | The provisional count, released first and later revised upward by 3,564. | Census 2019, provisional release Verified |
| 90,490 | People living in regular households — so it excludes institutional and transient population. | Census 2019 final report, table P-11 Verified |
| 90,949 | The commune database figure the Spatial Plan used. Close to the household count, and not the same thing. | Provincial Spatial Plan Reported |
| 92,213 | The final total population, which is the number to use when a source says “the 2019 census”. | Census 2019 final report Verified |
So the disagreement this Atlas flagged was real but mostly definitional: three of the four come from one census at different stages and on different definitions, and only the commune database is genuinely a different exercise. That is a better answer than “two sources disagree”, and it is only available because the final report was published six years after the count.
And the province has stopped filling up
This is the single most consequential number added to this Atlas. Every other page here describes a province filling up: migration in, concessions granted, forest converted, a growth-and-tenure section built on it. Between 2019 and 2024 that stopped. Growth fell from 3.7% a year to 0.3% — from among the fastest-growing provinces in Cambodia to the slowest. The survey also records the largest average household in the country at 4.9 people and the highest sex ratio at 105.2 men per 100 women, both consistent with a place that had been receiving working-age migrants and has stopped.
Nothing published explains why, and this Atlas is not going to invent a reason. It is worth setting beside three things already on this page: the collapse in domestic eco-tourism zone visitors after 2024, the province's unresolved land constraint, and the fact that its 2025 budget carried no capital spending at all.
The projection was wrong, and by how much
The National Institute of Statistics published a provincial projection to 2033 in July 2023. For 2024 it gives Mondulkiri 102,791. The survey measured 93,657. The projection overshot by 9,134 people, or 9.8% — because it was built on the 2008–2019 growth rate that has since collapsed. Its figure for 2026 is 105,636, and it is the only 2026 number that exists, so it is printed here with the warning attached rather than left out: treat it as an upper bound, not an estimate. Verified
One further caveat for anyone using the district table in that projection: it lists four districts for Mondulkiri and omits Saen Meaknourum entirely. The four do not sum to a provincial total, and a reader who adds them will be short by the municipality.
Not only Bunong
Mondulkiri is usually described as a Bunong province, and by weight of numbers that is right. But the NCDD's district data book records at least eight distinct indigenous peoples living in Kaoh Nheaek district alone. Flattening them into one category erases communities of a few dozen families.
Indigenous peoples of Kaoh Nheaek district
Population by group, 2008. The Bunong (Phnong) majority is real — and so is everyone else.
NCDD, Kaoh Nheaek District Data Book 2009 (district code 1102), §7.1 · Verified
Kaoh Nheaek land use
540,581 ha total. Forest dominates almost completely.
NCDD District Data Book 2009 · Verified. A 2009 baseline — read against later deforestation analysis in What the forest is worth.
Small groups are shrinking fast
Across just three years of records the Stieng fell from 14 families (76 people) in 2006 to 4 families (20 people) in 2008 — a 74% drop. Tampuan went from 58 families to 49. Phnong numbers held and grew slightly. When a community is only a few dozen people, ordinary migration can erase it from the record entirely within a decade.
NCDD Kaoh Nheaek District Data Book, §7.1, three-year series 2006–2008
How far the state actually is
Distance from Kaoh Nheaek district office to each commune office: Srae Sangkum 0 km (co-located), Srae Huy 5 km, A Buon Leu 9 km, Sokh San 10 km, Roya 12 km — and Nang Khi Lik 60 km. One commune in this district is twelve times further from its administration than the next-furthest. That is the practical meaning of "remote".
NCDD Kaoh Nheaek District Data Book, §3.2
Who actually holds title to the land
Cambodia's 2001 Land Law and the 2009 Sub-Decree on Indigenous Communal Land Registration allow an indigenous community to hold land collectively — residential, agricultural, spirit forest and burial forest together, in one title that cannot be sold off parcel by parcel. It is the single strongest legal protection a Bunong village has. Nationally, fewer than forty communities have ever completed the process. The provincial GIS shows how few that is on the ground here.
287 of 300 titled parcels are communal
The provincial land-title layer holds 300 parcel records. 287 of them — 95.7% — are Indigenous Communal Land Titles, held by just seven communities. The remaining 13 are ordinary state land-registration parcels. Read plainly: outside those seven communities, almost nothing in this database is titled at all.
Mondulkiri provincial GIS (MDKPSPDATABASE), layer 40 “Land Titles”, field LTitle_Typ. Counts queried directly from the service.
Seven communities is not many
Mondulkiri has hundreds of villages, the large majority of them indigenous. Seven titled communities means the overwhelming majority of Bunong villages hold their land under customary claim only — recognised in principle by the Land Law, but not registered, not mapped, and far weaker in any dispute with a concession, a mine or a private buyer.
Derived from the GIS layer. The count is what this database holds — a community titled after the layer was last updated would not appear.
| Community | Parcels | Village geocode | District |
|---|---|---|---|
| Ou Rona | 63 | 11010402 | Kaev Seima |
| Sre Ktom | 61 | 11010407 | Kaev Seima |
| Pou Trom | 60 | 11050401 | Saen Meaknourum |
| Andoung Kra Leung | 41 | — | Not coded in the database |
| Ou Chra | 27 | 11010504 | Kaev Seima |
| KhaTi | 22 | 11010501 | Kaev Seima |
| Sre Lui | 13 | 11010405 | Kaev Seima |
| Total | 287 | Five of seven sit in Kaev Seima district. | |
How to read this table. A "parcel" is one mapped polygon inside a community's title, not one family's plot — a single community title is registered as many parcels covering different land uses. Parcel counts therefore show how finely a title was surveyed, not how much land it covers. Village geocodes are the standard Cambodian eight-digit code (province 11 · district · commune · village); district names are resolved from the 1101–1105 district codes. Andoung Kra Leung carries a blank geocode in the source table, so its district is left unstated here rather than guessed.
Source: Mondulkiri provincial GIS database, FeatureServer layer 40. Parcel counts queried per community and cross-checked — 63 + 61 + 60 + 41 + 27 + 22 + 13 = 287, matching the service's own count of communal records exactly. District codes per NCDD/Cambodian standard geocoding.
◆ Open buffer — peoples & communities
Reserved for district data books for the other four districts, language survey data, community mapping, oral-history records, or the MLMUPC communal title certificates (date of issue and hectares) for the seven communities above.
What the forest is worth
In 2016 WWF put an economic value on Mondulkiri's forest — carbon storage, non-timber forest products and water yield — and modelled three futures to 2030. It is the single most useful document for anyone arguing about land use here, because it converts "protect the forest" from a sentiment into a number.
Three futures for 2030, priced
Change in the annual value of three ecosystem services in 2030, against a 2010 baseline. Business-as-usual is the costly option.
WWF-Cambodia, Mapping and Valuing Ecosystem Services in Mondulkiri (2016), Table i · Verified. Bars show magnitude of change; conservation is a gain, the other two are losses.
Forest income is household income
Non-timber forest products as a share of mean household income — the number that makes this a livelihoods question, not just an environmental one.
WWF-Cambodia 2016 · Verified. The report notes that combined NTFP and water losses under BAU are equivalent to roughly half of household income.
The carbon opportunity
Assuming conservatively that only 20% of additional stored carbon could be credited and sold, the study estimates 74 million tonnes of CO₂ saleable under a conservation path and 48 million under a green-economy path — worth $536M and $348M respectively over 2010–2030. Under business-as-usual, no credits are saleable at all. Factoring in the social cost of carbon, the losses under green-economy and BAU paths run to $7bn and $21bn.
WWF-Cambodia, Mapping and Valuing Ecosystem Services in Mondulkiri (2016)
Forest products, in dollars
Non-timber forest products — resin, honey, rattan, wild foods, medicines — contributed almost US$26 million a year to the economy at the 2010 baseline. Under business-as-usual that falls to $10.6 million by 2030. Water-yield regulation loses close to $7 million a year on the same path.
WWF-Cambodia 2016, Tables ii and iii
Forty-one years of forest, and what the total hides
Verified Source: Hectare forest cover by province in Cambodia (1973–2014), Open Development Cambodia. Zonal statistics in ArcGIS over ODC's forest-cover raster, against Economic Census 2011 provincial boundaries. Licensed CC BY 4.0 — attribution, no share-alike.
This Atlas has carried two points: 1999 and 2019, from the Spatial Plan, with 303,464 ha of change between them. A start and an end and nothing in the middle. ODC derived forest cover for every province from satellite imagery at six dates and split it into dense and mixed. Mondulkiri now has a series.
A reader told only that forest fell a fifth would miss the important part. The total is down 19.9%, which is serious. Underneath it, two thirds of the dense forest is gone and mixed forest has grown by more than three quarters. The province did not simply lose forest; it thinned it.
Where these figures stop being trustworthy
Between 2004 and 2009 dense forest falls 503,953 ha while mixed rises 364,597. Then between 2009 and 2014 dense rises 50,646 ha while mixed falls 141,385. Dense forest does not regrow fifty thousand hectares in five years. That reversal is the signature of pixels moving between two classification categories, not of trees.
So the honest reading is layered: the total series is trustworthy, the long-run direction of the split is trustworthy — dense was already falling and mixed already rising from 1973, long before the unstable years — and the individual 2009 and 2014 dense figures are not. They are greyed in the table and drawn faint in the chart rather than presented as measurements.
| Year | Dense forest | Mixed forest | Total forest | Share of province |
|---|---|---|---|---|
| 1973 | 827,697 | 401,175 | 1,228,872 | 89.6% |
| 1989 | 806,367 | 418,763 | 1,225,129 | 89.3% |
| 2000 | 743,689 | 484,571 | 1,228,260 | 89.5% |
| 2004 | 724,790 | 489,192 | 1,213,981 | 88.5% |
| 2009 | 220,836 | 853,789 | 1,074,626 | 78.3% |
| 2014 | 271,483 | 712,404 | 983,886 | 71.7% |
Why this says 72% and the Spatial Plan says 89.8%
ODC’s 2014 total is 71.7% of the province as the GIS measures it. The Spatial Plan reports 89.8% forest cover for 2019. That is not a contradiction and neither figure is wrong: they count different things. The Plan folds rubber plantation, regrowth and “other forest” into its forest class; ODC’s dense-plus-mixed does not. A province can lose closed-canopy forest and gain rubber and report more forest either way, depending which definition you reach for. Both are stated here; neither is reconciled away.
Twenty-five years of forest loss, and who is counting
Start with what does not exist. There is no official Cambodian forest cover figure for Mondulkiri at any recent date. The Forestry Administration's national series still rests on its 2010 assessment; no ministry publishes a provincial number. Every figure below is satellite-derived, from the University of Maryland's global analysis distributed through Global Forest Watch. For a province whose whole argument is about forest, that is the gap worth naming first.
Annual tree cover loss, Mondulkiri
Hectares a year at a 30% canopy threshold. Darker bars are the years above 8,000 ha.
University of Maryland / Global Forest Watch, series to 2025 · Reported
The shape is the finding. Loss ran under 2,000 ha a year until 2007, climbed through the concession years to a peak of 13,512 ha in 2014, stayed above 7,500 ha through 2021 with one dip, and has fallen every year since 2021 to 3,787 ha in 2025. Humid primary forest loss follows the same curve and reached 1,426 ha in 2025, the lowest since 2004. Whatever is driving it — the concession moratorium, the protected-area reclassifications, the carbon project, exhaustion of the accessible frontier, or all four — the last four years are a genuine inflection and not noise.
Two cautions before anyone uses this series. Tree cover loss is not deforestation: it counts rubber and plantation harvest alongside forest clearing, and this province has 43,912 ha of rubber. And the 2001–2025 total is loss without any offsetting gain, so it is not a net figure. Read it as the rate at which canopy came down, which is what it measures. Reported
Protected areas, by instrument
Layer 44 gives each protected area with the legal instrument that created it, the year it was signed, its managing agency and its measured hectares. It resolves a confusion this Atlas had been carrying, and adds a sanctuary I had never mentioned.
| Protected area | Type | Instrument | Year | Agency | Hectares |
|---|---|---|---|---|---|
| Srepok | Wildlife Sanctuary | Sub-Decree | 2002 | FA / MAFF | 372,658.8 |
| Keo Seima | Wildlife Sanctuary | Sub-Decree | 2009 | FA / MAFF | 293,993.4 |
| Lomphat | Wildlife Sanctuary | Royal Decree | 1993 | DNCP / MoE | 248,013.9 (shared with Ratanakiri) |
| Phnom Prich | Wildlife Sanctuary | Royal Decree | 1993 | DNCP / MoE | 222,047.5 |
| Phnom Namlear | Wildlife Sanctuary | Royal Decree | 1993 | DNCP / MoE | 45,899.8 |
| Ou Ya Dav | Protected Forest | Sub-Decree | 2009 | FA / MAFF | 100,836.8 (Ratanakiri only) |
Phnom Namlear Wildlife Sanctuary
A 45,899.8 ha sanctuary in Mondulkiri, created by Royal Decree in 1993 alongside Phnom Prich and Lomphat, managed by the Ministry of Environment. It appears in the province's own map sheets but had not featured anywhere in this Atlas's text until now — a reminder that a place can be legally protected for three decades and still be absent from the public account of the province.
WWF PSP Database layer 44 (Protected Areas)
Keo Seima has two "founding" dates, and both are right
This Atlas cites Sub-Decree 69 of 2016 for Keo Seima. The GIS register gives 2009, by Sub-Decree, under the Forestry Administration. Both are correct and describe different events: 2009 established it as a Protection Forest under MAFF; 2016 converted it to a Wildlife Sanctuary under the Ministry of Environment. The layer still lists FA/MAFF as managing agency, predating that handover.
WWF PSP layer 44 vs Sub-Decree 69 (2016) · reconciled here
Two ministries, split by vintage
The 1993 Royal Decree areas — Phnom Prich, Phnom Namlear, Lomphat — sit with the Ministry of Environment. The Sub-Decree areas of 2002 and 2009 — Srepok, Keo Seima, Ou Ya Dav — sit with the Forestry Administration under MAFF. Which ministry you approach about a given forest depends on which decade it was protected in.
WWF PSP layer 44, field MGT_AGENCY
Mondulkiri's own protected total
Counting only areas wholly inside the province — Srepok, Keo Seima, Phnom Prich and Phnom Namlear — gives 934,599 ha, or about 65.4% of the province, before adding Mondulkiri's share of Lomphat. That closely matches the Spatial Plan's independent figure of 925,835 ha and 64.8%, which is a useful cross-check that both are measuring honestly.
Our sum of WWF PSP layer 44, compared against Provincial Spatial Plan Table 4
What "protected" actually permits
A wildlife sanctuary is not one uniform rule. Under Cambodia's Protected Area Law each one is divided into four zones with very different permissions, and the zoning map is where conservation policy meets a household's ability to farm. The provincial GIS holds the January 2017 zoning for Phnom Prich Wildlife Sanctuary — the only Mondulkiri sanctuary whose full zoning sits in this database.
Phnom Prich Wildlife Sanctuary, by zone
222,090 ha total. Community Use — the zone where residents may farm and build — is 3.0% of it.
Mondulkiri provincial GIS, layer 48 “Cambodia Mondulkiri Land Use (PPWS Jan 2017)”, field Hectares. Four polygons, one per zone; the four sum to 222,089.6 ha, consistent with the sanctuary's commonly cited extent. Percentages are ours.
Three sanctuaries, three completely different bargains
The provincial GIS holds full four-zone plans for three of Mondulkiri's sanctuaries. Set side by side they show that "protected area" describes a legal category, not a consistent deal with the people living inside one. The share of land where residence and farming are recognised outright ranges from 3% to 12% — a fourfold difference between neighbouring sanctuaries.
| Zone | Srepok | Lomphat | Phnom Prich |
|---|---|---|---|
| Core — research only | 209,205 ha · 55.9% | 42,616 ha · 16.8% | 45,480 ha · 20.5% |
| Conservation — customary NTFP use | 52,895 ha · 14.1% | 107,034 ha · 42.1% | 80,034 ha · 36.0% |
| Sustainable use — development can be authorised | 66,008 ha · 17.7% | 80,438 ha · 31.7% | 89,857 ha · 40.5% |
| Community — settlement & farming recognised | 45,946 ha · 12.3% | 24,064 ha · 9.5% | 6,719 ha · 3.0% |
| Total | 374,053 ha | 254,152 ha | 222,090 ha |
Srepok is a fortress; Phnom Prich is a workshop
Over half of Srepok — 55.9% — is Core Zone, closed to everything but research. Phnom Prich puts only 20.5% in Core and 40.5% into Sustainable Use, the category where the government may authorise economic development. Two sanctuaries in one province, managed on almost opposite philosophies. Srepok also gives its residents four times the recognised living space: 12.3% against 3.0%.
Provincial GIS layers 47 and 48. Zone areas summed per category and cross-checked against each sanctuary's own boundary polygon in layer 44 (Srepok 0.37% apart, Phnom Prich 0.02% apart).
Lomphat's second column of numbers
The Lomphat zoning layer carries two area fields, and the difference between them is instructive. The GIS-measured areas total 254,152 ha. The "accepted" areas total 249,999.6 ha — and every single polygon is scaled by exactly the same factor, 0.98366. That is not case-by-case adjudication; it is the measured map being rescaled so the sanctuary's total lands on the declared figure of 250,000 ha.
Provincial GIS layer 46, fields Area_ha and Accept_ha. The uniform ratio holds to five decimal places across all fourteen polygons.
Two honest notes on this table. Lomphat straddles the Ratanakiri border — the source records its provinces as “Rattanakiri-Mondulkiri” — so its totals are the whole sanctuary, not Mondulkiri's share, which the GIS does not separate. And the Srepok layer carried no name field in the records we first read, so we identified it by summing its zones to 374,053 ha and matching that against every protected-area polygon in the database: Srepok was 0.37% away, the next nearest candidate 27% away. We published that as an inference from geometry rather than a label. The service’s own layer index has since confirmed it — the layer is titled “Cambodia Mondulkiri Srepok Wildlife Sanctuary Zoning (Aug 2018 final version)”. The inference was right, and it is now a citation.
◆ Open buffer — sanctuary zoning
One Srepok Sustainable Use block of 15,347 ha is flagged “Proposed to establish CPAs” in the source. If that proposal has since been decided either way, it belongs here. Keo Seima's zoning plan is still absent from the database entirely — and, it now turns out, from Open Development Cambodia's national compilation too, which digitises zoning sub-decrees straight from the Royal Gazette and covers eight protected areas without including this one. See the zoning section. The gap is national, not a provincial filing failure.
The Core Zone is closed to all but research and monitoring. The Conservation Use Zone allows only small-scale non-timber forest product collection by customary users. The Sustainable Use Zone is where economic development can be authorised by the government. The Community Use Zone is the only category that recognises settlement, farming and residence outright — and it is 3% of the sanctuary. Whether that 3% matches where people actually live is the question this map does not answer, and the honest reason land conflict recurs inside protected areas.
Boundaries are indicative only. The line shown between Mondulkiri and Viet Nam is drawn from a simplified provincial GIS layer and does not represent the international boundary. Delimitation and demarcation of that boundary are matters for the Royal Government of Cambodia and the Government of Viet Nam; only maps published under their authority are official.ព្រំដែនដែលបង្ហាញ ជាការប្រមាណប៉ុណ្ណោះ។ ខ្សែរវាងខេត្តមណ្ឌលគិរី និងប្រទេសវៀតណាម មិនមែនជាព្រំដែនអន្តរជាតិផ្លូវការទេ។ មានតែផែនទីដែលបោះពុម្ពដោយអាជ្ញាធររដ្ឋប៉ុណ្ណោះ ដែលមានលក្ខណៈផ្លូវការ។
Provincial GIS layer 48, “Land Use (PPWS Jan 2017)”. Drawn in the same frame as the other maps, so the sanctuary can be placed against the districts around it.
Community Protected Areas: 23 agreements, 63,300 ha
A Community Protected Area (CPA) is a formal agreement letting a village manage and use a defined block inside a sanctuary. It is the main mechanism by which people who live in a protected area keep legal access to it. The provincial GIS holds 23 current community agreements covering 63,300 ha — and they are distributed with striking evenness.
Nine and nine
Srepok Wildlife Sanctuary holds 9 CPAs over 34,998 ha. Phnom Prich holds 9 CPAs over 22,474 ha. Same number of agreements, but Srepok's average CPA is 3,889 ha against Phnom Prich's 2,497 ha — Srepok's blocks are roughly half again as large.
Provincial GIS layer 43, fields Project, Category, Hectares; all 23 records carry Status = “Current”.
The largest and the smallest
Tou Lung in Srepok is the largest community block in the province at 7,083 ha — bigger than the next two combined. At the other end, four Community Forestry sites (a different, Forestry Administration instrument) total just 4,153 ha between them: Phum Pou Ra Deth 1,343 ha, Phum Pou Kroch 1,183 ha, Phum Pou Lung 946 ha, Phum Pou Kreng 681 ha.
Provincial GIS layer 43, sorted by hectares.
| Name | Type | Sanctuary | Hectares |
|---|---|---|---|
| Tou Lung | CPA | Srepok | 7,082.7 |
| Yuk Namram | CPA | Srepok | 4,812.8 |
| Ou Nglav | CPA | Srepok | 4,700.6 |
| Maloel Kong Pros | CPA | Srepok | 4,654.9 |
| A Boun Lue | CPA | Srepok | 4,525.8 |
| Loa Romeat | CPA | Srepok | 3,223.1 |
| Sre Thom | CPA | Phnom Prich | 3,034.6 |
| Chiklob | CPA | Phnom Prich | 2,988.0 |
| Phnom Rohav | CPA | Phnom Prich | 2,957.5 |
| Poutung Pouhoung | CPA | Phnom Prich | 2,913.8 |
| Phnom Kduk | CPA | Phnom Prich | 2,815.1 |
| Pu Chrey | CPA | Srepok | 2,423.4 |
| Trapeng Khaerm | CPA | Srepok | 2,410.2 |
| Laoka | CPA | Phnom Prich | 2,228.0 |
| Antrong Samki Sen Chey | CPA | Phnom Prich | 2,021.3 |
| Sre Y | CPA | Phnom Prich | 1,777.6 |
| Ronus-Khnheng | CPA | Phnom Prich | 1,738.2 |
| Phnom Rohak | Uncategorised | Lomphat | 1,674.5 |
| Phum Pou Ra Deth | Community Forestry | — | 1,342.9 |
| Phum Pou Kroch | Community Forestry | — | 1,182.6 |
| Krang Ropuk | CPA | Srepok | 1,164.4 |
| Phum Pou Lung | Community Forestry | — | 946.4 |
| Phum Pou Kreng | Community Forestry | — | 681.3 |
| Total — 18 CPA, 4 Community Forestry, 1 uncategorised | 63,299.7 | ||
Source: Mondulkiri provincial GIS database, FeatureServer layer 43. Every record carries Status “Current”. The 23 hectare figures sum to 63,299.7 ha, and the CPA subtotals (Srepok 34,998.0 + Phnom Prich 22,474.1 = 57,472.1 ha) reconcile with the grand total once Community Forestry (4,153.1 ha) and Phnom Rohak (1,674.5 ha) are added. Phnom Rohak has a blank Category field in the source, so it is shown as uncategorised rather than assumed to be a CPA. Sanctuary attribution follows the source's Project code (PPWS / SWS / LPWS).
The same sanctuaries, two different sizes
The database holds two protected-area layers. Layer 44 is the one this Atlas has been quoting; layer 51 is the Ministry of Environment's national set. They cover the same ground and they do not agree — on names, on legal instruments, or on how big these places are. Their stated hectare fields differ by 78,120 ha. Measured from the polygons instead, the real difference is 27,279 ha — and layer 51 turns out to be the 1993 and 2002 designations rather than a rival survey. The vintages panel works it out, and corrects the figure this Atlas had been publishing.
| Area | Layer 44 | Layer 51 (MoE) | Difference, as stated | Difference, measured from geometry |
|---|---|---|---|---|
| Phnom Namlear / Namlyr | 45,900 ha | 54,903 ha | +9,003 ha · +19.6% | +9,198 ha · +20.0% |
| Srepok W.S / Mondulkiri Protected Forest | 372,659 ha | 428,377 ha | +55,719 ha · +15.0% | +2,403 ha · +0.6% (its hectare field is +14.2% out) |
| Keo Seima W.S / Seima Biodiversity Conservation Area | 293,993 ha | 302,386 ha | +8,392 ha · +2.9% | +9,387 ha · +3.2% |
| Lomphat / Lumphat W.S | 248,014 ha | 252,576 ha | +4,562 ha · +1.8% | +5,992 ha · +2.4% |
| Phnom Prich W.S | 222,047 ha | 222,490 ha | +443 ha · +0.2% | +300 ha · +0.1% |
| Total | 1,182,613 ha | 1,260,733 ha | +78,120 ha · +6.6% | +27,279 ha · +2.3% |
Phnom Namlear is either 45,900 ha or 54,903 ha
A 19.6% disagreement on the same royal decree, in the same database. Nine thousand hectares is not a rounding difference or a projection artefact — the other four areas agree to within 3% on the same basis. We have no way to adjudicate this from the GIS alone, so the Atlas quotes layer 44's 45,900 ha throughout and records here that the Ministry's own layer says otherwise.
Layer 44 Hectares against layer 51 HECTARES. Both cite the 1993 Royal Decree and both name MoE as administrator.
Three of them are recorded under their old names
Layer 51 still calls Srepok “Mondul Kiri Protected Forest” and Keo Seima “Seima Biodiversity Conservation Area”, both administered by the Forestry Administration under 2002 instruments. Layer 44 records them as Wildlife Sanctuaries. Both are correct for their moment: these areas were transferred from the FA to the Ministry of Environment and reclassified in 2016. The 15% size gap on Srepok is very likely that reclassification redrawing the boundary — which is exactly the sort of thing that gets lost when a single figure is quoted without its date.
Layer 51 fields ADMINISTRA, DESIGNATIO, YEAR_DESIG. The 2016 FA→MoE transfer is documented; the boundary change is our inference from the two figures, not a sourced fact.
Source: Mondulkiri provincial GIS, FeatureServer layers 44 and 51. Layer 51 is national — 41 protected areas across Cambodia — of which six touch Mondulkiri. Anyone citing a protected-area figure for this province should say which layer it came from and on what date; the two differ by more than the size of a whole sanctuary.
Two proposals that are not on any public map
A proposed tiger fence of 252,471 ha
The provincial GIS carries a layer named Proposed Tiger Fence (WWF). It holds three polygons totalling 252,471 ha — 17.7% of Mondulkiri — with a combined boundary of 605 km. The largest single enclosure is 135,583 ha. Cambodia has had no breeding tiger population since the last confirmed sighting in 2007, and the Eastern Plains is the landscape named in every reintroduction proposal; this layer is what that idea looks like drawn on the ground. The layer is set to hidden by default in the service, which is a fair signal of how settled it is.
Provincial GIS layer 49, fields Hectares and Perimeter. Three polygons: 135,583 + 100,395 + 16,494 ha; perimeters 366.8 + 172.0 + 65.8 km. No date, no status and no decision record accompany it.
The Northeast biodiversity corridor: 757,661 ha
A Ministry of Environment corridor layer (January 2017) maps eight polygons for the Northeast corridor totalling 757,661 ha, of which two blocks — 359,141 ha and 246,378 ha — make up 80% of the whole. Corridors are the connective tissue between protected areas; they are what allows elephant and other wide-ranging populations to remain genetically viable rather than becoming isolated pockets. The same layer also carries a separate Cardamom corridor, so these totals are the Northeast portion only.
Provincial GIS layer 50, “Biodiversity Corridor (MoE Jan 2017)”, filtered to Name = ‘Corridor Northeast’. The corridor extends beyond Mondulkiri; the GIS does not separate the provincial share.
◆ Open buffer — protected areas
Reserved for the zoning plans of Keo Seima, Srepok and Phnom Namlear (only Phnom Prich's is in the GIS), ranger patrol data, CPA agreement dates and member household counts, or species survey records.
The protected-area disagreement, resolved
This Atlas has been carrying an unresolved contradiction: the provincial database holds two protected-area layers, and they disagree. Until now all that could be said was by how much. Reading layer 51 properly settles it, and in doing so corrects a figure published further down this page.
Layer 51 is not a rival survey. It is an older one, and a national one.
The layer is named Cambodia Mondulkiri Protected_Areas (MoE), which suggests it describes this province. It does not. Its extent runs from 228,174 to 782,017 metres easting — the width of Cambodia — and it holds 41 protected areas nationally, of which five touch Mondulkiri. Its own description text is copied verbatim from the biodiversity-corridor layer, describing a “Cambodia Biordiversity Corridor”, misspelling included. This is the fourth layer in this database found to carry national extent behind a provincial name.
Every one of the five carries a designation year of 1993 or 2002. They are the original Royal Decree and Sub-Decree designations. Layer 44 is the current configuration. The two layers were never measuring the same moment, which is why nothing in the database “adjudicates” between them — there is nothing to adjudicate.
Correcting our own figure: 27,279 ha, not 78,120
The 78,120 ha figure this Atlas published came from adding up the difference between the two layers’ stated hectare fields. Recomputed from the polygons themselves, the five boundaries have moved +27,279 ha in total. The gap between those two answers is almost entirely one record.
Mondul Kiri Protected Forest — the 2002 designation covering the ground now called Srepok Wildlife Sanctuary — states 428,377 ha in its hectare field. Its polygon measures 375,062 ha. That is 14.2% out. Every other record in the layer agrees with its own geometry to within 0.6%. Measured honestly, Srepok’s boundary has moved 2,403 ha since 2002, not the 55,719 ha the attribute implies — a difference between a rounding-scale revision and a major reduction.
| Layer 51, as designated | Year | From its polygon | From its hectare field | Layer 44, current | Moved |
|---|---|---|---|---|---|
| Seima Biodiversity Conservation Areanow Keo Seima Wildlife Sanctuary | 2002 | 303,380 | 302,386 | 293,993 | +9,387 |
| Phnom Namlyr W.Snow Phnom Namlear Wildlife Sanctuary | 1993 | 55,098 | 54,903 | 45,900 | +9,198 |
| Lumphat W.Snow Lomphat Wildlife Sanctuary | 1993 | 254,006 | 252,576 | 248,014 | +5,992 |
| Mondul Kiri Protected Forestnow Srepok Wildlife Sanctuary | 2002 | 375,062 | 428,377 +14.2% | 372,659 | +2,403 |
| Phnom Prich W.Snow Phnom Prich Wildlife Sanctuary | 1993 | 222,800 | 222,490 | 222,500 | +300 |
| Total | +27,279 |
This is the second time an attribute in this database has been caught disagreeing with its own map. The first was the mining layer’s Hectares field. In both cases the geometry was right and the number beside it was not, which is a good reason to recompute rather than to read off.
Where the boundaries actually moved
A table of five numbers cannot show you where a boundary went. Phnom Namlear gained 20% and Keo Seima gained 3%, and they did it in completely different ways. Switch Boundaries 1993/2002 on in the interactive map above to watch the old outline against the current fills.
Boundaries are indicative only. The line shown between Mondulkiri and Viet Nam is drawn from a simplified provincial GIS layer and does not represent the international boundary. Delimitation and demarcation of that boundary are matters for the Royal Government of Cambodia and the Government of Viet Nam; only maps published under their authority are official.ព្រំដែនដែលបង្ហាញ ជាការប្រមាណប៉ុណ្ណោះ។ ខ្សែរវាងខេត្តមណ្ឌលគិរី និងប្រទេសវៀតណាម មិនមែនជាព្រំដែនអន្តរជាតិផ្លូវការទេ។ មានតែផែនទីដែលបោះពុម្ពដោយអាជ្ញាធររដ្ឋប៉ុណ្ណោះ ដែលមានលក្ខណៈផ្លូវការ។
Derived · layers 44 and 51 of MDKPSPDATABASE, areas recomputed from polygon geometry on the WGS84 sphere. Layer 51 designations dated 1993 and 2002; layer 44 is the current configuration.
Who holds the land
Two registers sit side by side here, because they are the two competing claims on Mondulkiri's land: community-managed forest, and economic land concessions. Both are reproduced in full from the Provincial Spatial Plan's annexes.
Community Protected Areas
21 CPAs · 63,079 ha · 35 villages · 4,490 families
Provincial Department of Environment, 2019, via Provincial Spatial Plan Annex 8 · Verified
Economic Land Concessions
26 concessions · 162,303 ha — about 11% of the province. Largest holdings shown.
Provincial Spatial Plan Annex 9 (areas after Order 01) · Verified. Four "Pacific"-named concessions alone hold 38,057 ha.
People inside protected areas
3,495 households — 16.8% of the province — live inside a protected area. That single figure explains why conservation here cannot be run as simple exclusion: a sixth of Mondulkiri's population has its home, farm and burial grounds inside the boundary.
Provincial Department of Planning 2018, via Spatial Plan Annex 7
Collective Land Titles
Seven Collective Land Titles have been granted to indigenous communities, with another seven in the process of recognition or land measurement. Across the titled communities and others, delineated burial grounds and spirit forests total 470 ha — small in area, decisive in meaning.
Provincial Dept. of Land Management 2019, via Spatial Plan §2.4.3
What the concessions grow
Of the 26 concessions, 13 are explicitly rubber and two are pine plantation (Houlean 7,773 ha and Vouchisan 10,000 ha); the rest are unspecified. Fourteen were registered under the Ministry of Agriculture and seven under the Ministry of Environment — meaning a substantial share sit on land the environment ministry administers.
Provincial Spatial Plan Annex 9
Where the CPAs are
The 21 community areas cluster in Kaoh Nheaek (Rovak, Chiklob, Srae Thom-Mleng, A Buon Leu, Ou Nglav, Maloel Kong Pros, Yuk Namram) and Pechreada (Antrong Samki Sen Chey, Phnom Kduk, Krang Ropuk, Trapeang Khaerm, Pu Chrey, Tou Lung, Lao Romeat, Namlea), with four in Kaev Seima and two inside Sen Monorom's own sangkats.
Provincial Spatial Plan Annex 8, PDoE 2019
Who claims this land
Derived Computed here by putting every land claim in this Atlas against the same denominator. Component figures come from the provincial GIS (layers 39–44), the Spatial Plan, and Open Development Cambodia. The reconciliation and the two findings below are this Atlas’s own.
Each claim on Mondulkiri lives in its own section of this Atlas — protected areas here, concessions there, mining somewhere else, communal title newly arrived. Each is correct and each is alone. Nobody had put them side by side against the province’s actual area, because until the communal title figures arrived nobody could.
Ninety-eight percent, and why that is not true
Added up as published, the claims come to 1,348,568 ha against a province of 1,372,090 ha. That is 98.3%, which reads like a province entirely spoken for. It is not, because the registers overlap and nobody subtracts.
| Claim | Area | Share of the province |
|---|---|---|
| Protected areasFive wildlife sanctuaries under Royal Decree or Sub-decree | 915,947 ha | 66.8% |
| Economic land concessionsLong leases of state private land for agro-industry, mostly rubber | 195,398 ha | 14.2% |
| Live mining licencesValid exploration and extraction blocks; only 2,766 ha is being extracted | 163,586 ha | 11.9% |
| Community protected areas23 community agreements, all inside a sanctuary | 63,300 ha | 4.6% |
| Indigenous communal titleEight registered titles held by at least 497 families | 5,729 ha | 0.4% |
| Social land concessionsTwo polygons, and the GIS records no name, date or beneficiary for either | 4,608 ha | 0.3% |
| Summed as published | 1,348,568 ha | 98.3% |
Removing what is counted twice brings the total to 1,115,640 ha, 81.3%. The difference — 232,928 ha, seventeen percent of Mondulkiri — is land that appears in two registers at once.
| Counted in two registers | Area |
|---|---|
| Mining licence inside a protected area | 128,478 ha |
| Concession inside a protected area | 41,150 ha |
| Community protected areas, inside protected areas by definition | 63,300 ha |
| Total double-counted | 232,928 ha |
Eight and a half thousand hectares claimed three ways
This Atlas computed separately that 754,888 ha of protected area carries neither a mining licence nor a concession. So 161,059 ha of protected area carries one of them. But mining-inside-a-protected-area and concession-inside-a-protected-area add to 169,628 ha — 8,569 ha more than the union.
Those 8,569 hectares carry a mining licence, an economic land concession, and protected-area status, all at once. Three claims on one piece of ground. It follows by inclusion–exclusion from figures already published here, and it has not been stated anywhere before — including by this Atlas.
What this is not
It is not a complete deduplication, and the 81.3% figure should not be quoted as one. Only three overlaps are known and measured. Communal title sitting inside a protected area, a social land concession inside a concession, a mining block over an ELC outside a protected area — none of those has been computed. 81.3% is a ceiling on the unique footprint, not a measurement of it. The real figure is lower, and nobody knows by how much.
Communal title: the gap closed, and a sharper one opened
Verified Source: Registered indigenous communal land, Open Development Cambodia, compiled from MLMUPC sub-decrees, OHCHR Cambodia, and Development and Partnership in Action (DPA). 44 titles nationally, covering 2009–2025. Licensed CC BY 4.0.
This Atlas has been carrying an admission: seven titled communities were named with parcel counts, but without areas it was “impossible to say how much land is under communal title province-wide”. It is no longer impossible.
| Commune | Titled area | Families |
|---|---|---|
| Sen Monorom | 1,425.00 ha | not recorded |
| Bu Sra | 1,309.79 ha | 105 |
| Rummeaknea | 1,005.00 ha | 116 |
| Srae Khtum | 512.42 ha | 93 |
| Srae Preah | 417.80 ha | 45 |
| Srae Khtum | 406.88 ha | 80 |
| Srae Khtum | 358.51 ha | 31 |
| Srae Preah | 293.51 ha | 27 |
| Eight titles | 5,728.9 ha | 497 recorded |
The chain, closed end to end
This Atlas already held the sub-decrees that cut land out of Seima to release it for communal title. This registry holds the titles that were actually registered. Two of the three match to the hectare and to the family — from two separate datasets compiled from different sources, the Royal Gazette on one side and MLMUPC with NGO reporting on the other. That is a complete audit trail from the instrument that released the land to the title that now holds it.
| Instrument | Promulgated | Area released | Families | Title registered? |
|---|---|---|---|---|
| Sub-decree 239 | 2013-05-16 | 358.51 ha | 31 | Registered in Srae Khtum — exact to the hectare and the family |
| Sub-decree 250 | 2013-05-18 | 512.42 ha | 93 | Registered in Srae Khtum — exact to the hectare and the family |
| Sub-decree 62 | 2013-02-13 | 711.31 ha | 72 | No title of this size in the registry, any province |
The one that does not match
Sub-decree 62, promulgated 13 February 2013, cut 711.31 ha from the Seima Biodiversity Protected Area to grant Pnong communal ownership to 72 families. No registered title of 711.31 ha appears anywhere in the registry, in any province.
Two of three released parcels can be traced to a title. The third cannot. Either it was registered at a different area, or it was never registered at all — and these two sources cannot distinguish between those. That is stated rather than resolved. But it is a far sharper question than the one it replaces: it names the instrument, the date, the area, and the seventy-two families waiting on the answer.
One caution about the registry itself: ODC records a known inconsistency in it — the La En title in Ratanakiri is 1,454 ha per the United Nations and 1,218.56 ha per DPA. That is another province and does not touch the figures above, but it is a reminder that this is a registry assembled from reports, not a single authoritative register.
Four cuts in one month, March 2026
The slowest process in this province moved. Four sub-decrees, all indexed in March 2026, take land out of two protected areas, reclassify it as State private land, and hand it to Bunong communities as collective ownership — the mechanism this section describes as normally taking a decade.
| Sub-decree | Area | Cut from | To |
|---|---|---|---|
| No. 62 | 711.31 ha | Seima Biodiversity Protected Area | 72 families Verified |
| No. 239 | 358.51 ha | Seima Biodiversity Protected Area | 1 community, 31 families Verified |
| No. 247 | 406.88 ha | Snoul Wildlife Sanctuary | 1 community, 80 families Verified |
| No. 250 | 512.42 ha | Snoul Wildlife Sanctuary | 1 community, 93 families Verified |
| Total | 1,989.12 ha | Both, in Keo Seima district | 4 communities, about 276 families Derived |
Read alongside what the rest of this Atlas records, this cuts both ways and should be printed as such. It is the state doing the thing indigenous communities have been asking for, at a scale that is small but real: about 7.2 hectares per family. It is also four more excisions from protected areas in a province where excision by sub-decree is the mechanism by which protected land has repeatedly become something else. The same instrument does both jobs, and the only way to tell which is happening is to read who the land went to.
Two more instruments from the same period belong on the record: Prakas No. 76 of 16 July 2026 on establishing community forestry in Mondulkiri, and Prakas No. 061 of 11 August 2026 establishing the Ping Prong Klong Pesh Tho community forest at Poule village, Dak Dam commune. Verified
How people actually live
The National Institute of Statistics published sub-national data for five north-eastern provinces — Kratié, Stung Treng, Ratanakiri, Mondulkiri and Preah Vihear — in December 2020. Reading Mondulkiri against its neighbours is more useful than reading it against the national average, because these five share the same geography and the same constraints.
Households with a zinc or fibro roof
The standard proxy for housing quality in rural Cambodia.
NIS, Sub-National Statistics Results — Kratié, Stung Treng, Ratanakiri, Mondulkiri & Preah Vihear (Dec 2020), Fig. 11 · Verified. A further 13.1% of Mondulkiri households have tile roofs.
Farming with hand tools and machinery
Share of households using agricultural equipment and machinery — and, in contrast, draught animals.
NIS Sub-National Statistics 2020, Fig. 12 · Verified. In Mondulkiri only 2.5% still farm with draught animals — among the lowest of the five.
Where the province sits on human development
Mondulkiri's Human Development Index is recorded at 0.513 (Global Data Lab, 2019) — placing it among Cambodia's less-developed provinces. Nationally, 16.6% of Cambodians are multidimensionally poor and a further 20.5% are vulnerable to it, with a deprivation intensity of 42.3%.
UNDP Human Development Report MPI country profile; Global Data Lab subnational HDI
Commune-level poverty data exists but isn't public
Two systems measure poverty below provincial level: the Ministry of Planning's IDPoor household targeting, run on a three-year rolling cycle, and the Ministry of Interior's predictive poverty rates derived from the Commune Database, which do go down to commune level. Neither publishes an open Mondulkiri commune series, so this Atlas cannot show you which of the 21 communes is poorest — a gap worth naming rather than filling with a national average.
Ministry of Planning (IDPoor); Ministry of Interior Commune Database — availability assessed August 2026
◆ Open buffer — living conditions & poverty
Reserved for IDPoor extracts, commune database exports, household survey microdata, or NGO poverty assessments.
Where the services are, and how far
Seven more layers drawn: two referral hospitals, eighteen health facilities, 98 primary schools, 30 pre-schools, nine high schools, ten colleges, and the single power transmission line that reaches this province. Counted, they sound like a network. Drawn, they are a line: almost everything sits on NR76 or within a few kilometres of Sen Monorom, and the west and north are close to empty.
Boundaries are indicative only. The line shown between Mondulkiri and Viet Nam is drawn from a simplified provincial GIS layer and does not represent the international boundary. Delimitation and demarcation of that boundary are matters for the Royal Government of Cambodia and the Government of Viet Nam; only maps published under their authority are official.ព្រំដែនដែលបង្ហាញ ជាការប្រមាណប៉ុណ្ណោះ។ ខ្សែរវាងខេត្តមណ្ឌលគិរី និងប្រទេសវៀតណាម មិនមែនជាព្រំដែនអន្តរជាតិផ្លូវការទេ។ មានតែផែនទីដែលបោះពុម្ពដោយអាជ្ញាធររដ្ឋប៉ុណ្ណោះ ដែលមានលក្ខណៈផ្លូវការ។
How far is a village from care
The GIS holds village centres in one layer and health facilities in another, and never relates them — so this question has no answer in the database. Every one of the 77 mapped village centres is matched here to its nearest built facility by great-circle distance. Straight-line distance flatters the real journey, because in this province the road usually goes somewhere else first; treat every figure below as a floor, not an estimate.
The contrast is the finding. Primary schooling is genuinely distributed — a median of 1.5 km, and only 6 villages beyond 10 km. Health care is not. The median village is 7.0 km from the nearest built facility and 27.7 km from a hospital, and those medians hide a long tail in the west and north where the roads run out. Cambodia has put a school in nearly every village here. It has not done the same with clinics.
Boundaries are indicative only. The line shown between Mondulkiri and Viet Nam is drawn from a simplified provincial GIS layer and does not represent the international boundary. Delimitation and demarcation of that boundary are matters for the Royal Government of Cambodia and the Government of Viet Nam; only maps published under their authority are official.ព្រំដែនដែលបង្ហាញ ជាការប្រមាណប៉ុណ្ណោះ។ ខ្សែរវាងខេត្តមណ្ឌលគិរី និងប្រទេសវៀតណាម មិនមែនជាព្រំដែនអន្តរជាតិផ្លូវការទេ។ មានតែផែនទីដែលបោះពុម្ពដោយអាជ្ញាធររដ្ឋប៉ុណ្ណោះ ដែលមានលក្ខណៈផ្លូវការ។
What these layers do not say
- Twelve of the eighteen health records carry no name, district or commune — only a point and a type. Six of those are typed Future, so the province has 12 built facilities in this layer and 6 proposals.
- One of the nine high schools has no geometry at all. The record exists, the location field is empty, so it can be counted but not placed. Eight are drawn.
- Distances here are straight lines. On this terrain, with one north–south road, real travel distance is materially longer — especially in the wet season, when several of these routes are not reliably passable.
- The school layers date from 2012 and the health layers from 2008. They are the most recent in the database, not the most recent in existence.
Water & irrigation: the Srae Huy project
The single largest infrastructure intervention currently documented for Mondulkiri. A weir built in 1975–77 in Kaoh Nheaek breached around 1980 and has never worked properly since. Rebuilding it is now funded under the Cambodia Water Security Improvement Project (P176615), running 2024–2030.
Irrigated area, before and after
A 5.3× expansion — the difference between a token scheme and a functioning one.
MOWRAM / MAFF, Draft ESMP — Srae Huy Subproject, CWSIP P176615 · Verified
Project budget by component
US$145M nationally, 2024–2030. Srae Huy sits inside Component 2.
CWSIP P176615 component structure · Verified. A fifth component (contingency emergency response) is unfunded at $0M.
What actually gets built
The breached weir is upgraded to a gated diversion barrage with head works on both banks — right bank feeding the O Prang scheme, left bank feeding Mchou Ngha. Plus two new main canals (4 km and 4.6 km), 61.4 km of existing canal network improved, a 3 km flood levee, 3.5 km of stream dredging, riverbank protection and 90 irrigation control structures.
Draft ESMP, Srae Huy Subproject, §1
Why it matters here: almost nobody has irrigation
Srae Huy commune farms 3,253 ha of rice, but only 400 ha — 11.7% — has any access to irrigation, reaching just 30 households (3.9%). Yields sit at 3.0 t/ha for wet rice, and average income from rice is about US$560 per person per year. This project is the difference between rain-fed subsistence and a second crop.
Draft ESMP §3.4, citing the 2022 commune database
Who lives there
The subproject spans Srae Huy and Roya communes in Kaoh Nheaek. Srae Huy commune has 3,062–3,169 residents across 776 households (avg 3.9 people), of whom 2,242 people in 618 households are Bunong — 323 households in Srae Huy village, 295 in Chhoul. Srae Huy commune covers 89,086 ha; Roya covers 239,331 ha. Two households (0.3%) live inside a protected area.
Draft ESMP §3.1 and §3.4, commune database 2022
A stark schooling gap between neighbouring communes
Srae Huy commune has 4 public primary schools and a 45.9% enrolment rate for six-year-olds. Roya commune, next door, has 7 schools and 73.3%. That is a 27-point gap between two adjacent communes in the same district — one of the sharpest inequalities surfaced anywhere in this Atlas, and it is not explained in the source document.
Draft ESMP §3.4 · The disparity is recorded, not accounted for
Landlessness in the command area
In Srae Huy commune 356 households own no farmland at all, and roughly 7% of households have no cultivated land. In Roya, 72 households have no farmland and 73 have no paddy. Who captures the benefit of 4,500 new irrigated hectares is therefore a live distributional question, not a technical one.
Draft ESMP §3.4
Local climate, measured 2018–2022
Annual average 27.2°C, with a January minimum averaging 16.2°C and an April maximum averaging 37.0°C. Dry season runs December to April — typically only three to four months, shorter than much of Cambodia, but long enough that drought risk to water availability is explicitly flagged.
Draft ESMP §3.1, five-year local station record
When the province was cleared
The settlement layer is the most quietly powerful thing in this database. Every one of its 1,134 footprints can carry a clearance year, traced to a specific named Landsat scene — so it is not a snapshot of where people live, it is a record of when each patch of ground was opened. 532 polygons carry a date. Sorted by decade, they describe an acceleration.
Dated settlement clearance, by period
532 dated footprints. Three quarters of them were cleared after 2010.
Provincial GIS layer 17, field CLEARYEAR1, counted by the service in five-year bands.
Nine times the rate, inside fifteen years
Between 2000 and 2004, 55 settlement footprints were cleared — about 11 a year. In 2015 and 2016 alone, 203 were cleared: roughly 102 a year. That is a ninefold increase in the rate of new ground being opened, and it lines up with the period in which the economic land concessions were granted and the roads improved. The layer stops in 2016, so what has happened since is not in this record.
Derived from layer 17 band counts: 55 over 5 years against 203 over 2 years.
Half the footprints have no date at all
602 of 1,134 polygons — 53% — carry no clearance year. Nothing is dated before 2000 either: a query for any 1990s year returns zero, so those blanks are missing data, not older clearance. The acceleration above is therefore measured on the half of the record that was dated, and the true totals are higher than the counts shown. Treat the shape of the trend as sound and the absolute numbers as a floor.
Provincial GIS layer 17. Blank CLEARYEAR1 sorts below “2000”, which is why a naive range query appears to find 602 pre-2000 records; a LIKE '19%' test returns none.
Source: Mondulkiri provincial GIS, FeatureServer layer 17 (settlement areas, WWF updated 2017). Footprints are classified as village, village mosaic, buildings or construction site; 279 are tagged plainly as “village”. Each dated polygon names the Landsat scene the clearance was read from, so individual entries can be re-checked against the original imagery.
Boundaries are indicative only. The line shown between Mondulkiri and Viet Nam is drawn from a simplified provincial GIS layer and does not represent the international boundary. Delimitation and demarcation of that boundary are matters for the Royal Government of Cambodia and the Government of Viet Nam; only maps published under their authority are official.ព្រំដែនដែលបង្ហាញ ជាការប្រមាណប៉ុណ្ណោះ។ ខ្សែរវាងខេត្តមណ្ឌលគិរី និងប្រទេសវៀតណាម មិនមែនជាព្រំដែនអន្តរជាតិផ្លូវការទេ។ មានតែផែនទីដែលបោះពុម្ពដោយអាជ្ញាធររដ្ឋប៉ុណ្ណោះ ដែលមានលក្ខណៈផ្លូវការ។
Provincial GIS layer 2, “Village Centers”, over the district boundaries of layer 5. The province records 90 villages; 77 have a mapped centre point — see the data gaps.
The five districts, measured
The boundary layer carries each district's official code, its Khmer and English names, its class, and — usefully — its own count of communes and villages. Together they total 21 communes and 90 villages across 1,372,090 ha, which is 96.0% of the province's cited 1,428,800 ha.
| District | Code | Communes | Villages | Hectares | ha / village |
|---|---|---|---|---|---|
| Kaoh Nheaek | 1102 | 6 | 26 | 529,422 | 20,362 |
| Pechreada | 1104 | 4 | 18 | 381,891 | 21,216 |
| Kaev Seima | 1101 | 5 | 25 | 280,915 | 11,237 |
| Ou Reang | 1103 | 2 | 7 | 125,950 | 17,993 |
| Saen Meaknourum (City) | 1105 | 4 | 14 | 53,912 | 3,851 |
| Total | 21 | 90 | 1,372,090 | 15,245 |
Kaoh Nheaek is ten times the size of the capital
Kaoh Nheaek covers 529,422 ha — 9.8 times Saen Meaknourum City's 53,912 ha, and by itself more than a third of the province. It also has the most communes (6) and villages (26). Pair that with the district data book figure that one of its communes sits 60 km from its own district office, and the administrative geography stops being an abstraction: this is a single district the size of a small country, run from one town.
Provincial GIS layer 5, fields Hectares, NUM_COMMUN, NUM_VILLAG.
21,216 ha per village, or 3,851
Divide each district's area by its villages and the spread is 5.5-fold: a village in Pechreada nominally sits in 21,216 ha of territory, one in Saen Meaknourum City in 3,851 ha. This is not a density figure — most of that land is forest, not farmed — but it is a fair proxy for how far apart things are, and therefore for what it costs to deliver a school, a clinic or a road to each one.
Derived from layer 5. Village counts are the layer's own and predate any subsequent boundary changes.
Source: Mondulkiri provincial GIS, FeatureServer layer 5, “Admin District Boundaries (2014)”. The five districts sum to 1,372,090 ha against the 1,428,800 ha usually cited for the province — a 4% shortfall consistent with boundary generalisation at this scale. Saen Meaknourum is classed City (ក្រុង) rather than District (ស្រុក); the other four are districts.
◆ Open buffer — water & infrastructure
Reserved for detailed design documents, FWUC records, updated ESMPs, hydrological series, or other subproject files.
Provincial Finance
What the province actually has to spend. Figures below are extracted from the Ministry of Economy and Finance's Budget in Brief for Sub-National Administration, Fiscal Year 2025 — the official published allocation, not an estimate.
Where Mondulkiri sits among the 25 provinces
FY2025 provincial administration budgets, million riel. Phnom Penh is excluded — at 964,788M it would flatten everything else.
MEF, Budget in Brief for Sub-National Administration FY2025, Table 6.3 · Verified
Recurrent vs. capital spending
The single most important fact about the province's finances: there is no capital budget at all for 2025.
MEF Budget in Brief FY2025 · Verified. Any infrastructure built in the province this year is financed from national ministry programmes or development partners.
A small budget, but a large one per head
Mondulkiri receives about 1.07% of the 3,554,502 million riel distributed across all 25 provincial administrations, while holding roughly 0.59% of Cambodia's population — so its allocation runs at close to 1.8× its population share. That is consistent with how thinly-populated, high-cost-to-serve provinces are funded, and is worth bearing in mind before reading the headline figure as simple underfunding.
Our calculation from MEF FY2025 provincial allocations and the 2019 census — a derived comparison, not a government statement
Zero capital budget is the headline
Of the 25 provinces, Mondulkiri is one of only four with a dash rather than a number in the capital-expenditure column for 2025 (alongside Kratié, Stung Treng and Oddar Meanchey). Everything budgeted is recurrent — salaries, operations, administration. Any road, clinic, school or water infrastructure built in the province this year is therefore financed from national ministry programmes or development partners, not from the provincial administration's own budget line.
MEF, Budget in Brief for Sub-National Administration FY2025, Table 6.3
Where district budgets sit
District and municipal administrations nationally hold a separate 2,341,519.9 million riel pool for 2025, up 12.8% on 2024. Within it, 1,917,522.5 million riel is non-payroll operating spend and 423,998.4 million riel is payroll. Mondulkiri's four districts and one municipality draw from this pool in addition to the provincial figure above.
MEF, Budget in Brief FY2025, section 3.3
National context for 2025
The figures above sit inside a national budget projecting 6.3% GDP growth, GDP per capita of US$2,924, inflation of 2.5% and an exchange rate of 4,069 riel to the dollar. Total sub-national administration budgets come to 7,193,664 million riel, up 3.2% year on year.
MEF, Budget in Brief FY2025, Tables 1 and 3
Infrastructure & Connectivity
Telecommunications
Cambodia's three national mobile operators — Smart Axiata, Cellcard, and Metfone — all provide 4G coverage in Sen Monorom and the district towns (Kaoh Nheaek, O'Reang, Pech Chenda, Kaev Seima). Coverage thins quickly once you're inside forest concessions, protected areas, or on unpaved rural roads — don't count on a signal past the last village.
General operator coverage patterns; not a per-village survey
Roads & Wet-Season Transit
National Road 76 connects Mondulkiri to Ratanakiri and links to National Road 7 toward Kratié and Phnom Penh (~390 km). A section of NR76 at O'Ngei point collapsed in August 2023 and was fully repaved and reopened by January 2024 — a reminder that laterite and rural roads are genuinely vulnerable during the May–October wet season. Budget extra travel time and avoid unpaved district roads after heavy rain.
Ministry of Public Works and Transport; Khmer Times, Jan 2024
Electricity grid, in numbers
The provincial network runs 357 transformer stations, 612.69 km of medium-voltage line and 335.90 km of low-voltage line, against a peak demand of just 6.789 MW — a genuinely small load by national standards. 14,120 households are connected: 7,850 in Sen Monorom, 2,860 in Kaev Seima, 2,624 in Kaoh Nheaek and 1,780 in Pechreada. Supply comes partly from a 35 kV feed out of Ratanakiri serving Kaoh Nheaek, and partly from the province's own substation.
Ministry of Interior Information Book on Capitals and Provinces, March 2024, p.112
What power and water actually cost
Electricity is billed on the national tariff ladder across Sen Monorom, Ou Reang, Kaoh Nheaek and Pechreada: 480 riel/kWh up to 50 kWh a month, 610 riel/kWh from 51–200 kWh, and 730 riel/kWh above 200 kWh. Piped water runs 1,800–2,000 riel per cubic metre. At roughly 4,069 riel to the dollar, that puts household electricity at about 12–18 US cents per kWh.
Ministry of Interior Information Book 2024, p.112 (tariffs per Electricity Authority of Cambodia)
Municipal water capacity
The provincial water system has a rated production capacity of 2,000 m³/day but is recorded as actually producing 2,300 m³/day — running above its nominal design capacity. That is worth knowing before assuming headroom exists for new connections or development at scale.
Ministry of Interior Information Book 2024, p.112
Water Supply
Sen Monorom has a piped municipal supply serving the town center; most rural villages rely on wells, rainwater collection, or community-managed systems. Water pressure and reliability in guesthouses and rentals vary by property — check in person before signing a lease (see Living Here for more).
General pattern for provincial Cambodia; not independently verified per-commune
Airport Development
Sen Monorom's existing airstrip (1,817 m, laterite surface) is not currently in service. A phased Mondulkiri International Airport project — Type 4C (short-term, 2020–2025, capable of handling B737/A319-320) expanding to Type 4E (medium-term, 2025–2035, capable of B747/A330-340) — is planned roughly 20 km south of Sen Monorom.
Provincial development planning documents, via IntoCambodia.org
One settlement layer, shipped twice
The service lists two settlement layers under near-identical names — layer 17 “Settlement Areas (WWF Updated 2017)” and layer 38 “Settlement Area (WWF updated 2017)”. They are the same data: both hold exactly 1,134 polygons, and both return exactly 203 records for clearance from 2015 onward. Anyone combining “all settlement layers” from this service would double-count the province's built footprint. The clearance chronology above is computed from layer 17 only.
Provincial GIS layers 17 and 38, matched on total count and on a distinctive CLEARYEAR1 filter. We have not compared them polygon by polygon, so “identical” is inferred from two matching counts rather than proven exhaustively.
Checking the elevation range against the contours
This Atlas has stated since its first version that Mondulkiri runs from about 200 m in the lowlands to just over 1,000 m at Phnom Nam Lyr. The contour layer lets that be tested rather than repeated — but only after clearing a trap that would have produced a badly wrong answer.
The contour layer is national, not provincial
Sorted by elevation, the highest contour in this layer is 1,760 m. Quoting that as Mondulkiri's high point would have been wrong by 700 m — it is almost certainly Phnom Aural in Kampong Speu, Cambodia's highest peak. The layer holds 190,578 segments covering the whole country, and 4,253 of them sit above 1,100 m. Restricted to a bounding box around Mondulkiri, the count above 1,100 m is zero.
Provincial GIS layer 29, field SPOT (elevation in metres). Counts with and without an esriGeometryEnvelope filter on the province's extent.
1,060 m, and the figure holds
Within the province the highest contour is 1,060 m, and only eight segments sit above 1,000 m at all — 1,020, 1,040 and 1,060, on a 20 m interval. That is a very small area of high ground, consistent with a single massif rather than a range. Our long-standing claim of “just over 1,000 m at Phnom Nam Lyr” is corroborated by the contour data, independently of the source it originally came from.
Layer 29 filtered to the provincial envelope. Below 100 m there are 696 segments and below 60 m only 6, so the province's floor sits well under the 200 m usually quoted for the plateau — the lowland fringe drops further than the headline range suggests.
Source: Mondulkiri provincial GIS, FeatureServer layer 29 (contour lines). This is the third layer in this database found to carry national rather than provincial extent — the others being the soil and geology tables, whose area fields describe national polygons. Any figure drawn from this service should be checked for whether the layer was actually clipped to Mondulkiri before it is quoted.
What the soils actually are
The productivity layer above says how good the soil is; this one says what it is. Crocker's classification — the 1962 survey still used as Cambodia's soil reference — divides the province into 58 polygons across nine soil types.
| Soil type | What it is |
|---|---|
| Latosols | The deep red basalt soils — the fertile ground under the coffee, rubber, pepper and cashew. Only 4 of the 58 polygons. |
| Red-yellow podzols | Leached forest soils, moderately acid, low in nutrients |
| Plinthite podzols | Podzols with an iron-rich layer that hardens irreversibly once exposed and dried |
| Acid Lithosols | Thin stony soils over acid rock; shallow, poor, easily eroded |
| Basic Lithosols | Thin stony soils over basic rock; better chemistry, still shallow |
| Alluvial Lithosols | Thin soils on river deposits |
| Grey hydromorphics | Seasonally waterlogged; the classic paddy soils |
| Plinthitic hydromorphics | Waterlogged with a plinthite layer — hard to drain and hard to work |
| Regurs | Dark cracking clays, high in nutrients but very heavy to cultivate |
Lithosols and podzols dominate; latosols are the prize
Five of the nine types are thin, stony or leached soils, which is the same story the 61% low-productivity figure tells in different words. The latosols — the red basalt clays — appear in only four polygons, and those four are the province's entire commercial agriculture. It is worth naming the plinthite soils too: their iron-rich layer sets like brick once the forest above it is cleared and it dries out, so ground that looks farmable can be permanently lost by the act of clearing it.
Provincial GIS layer 31, field SOILTEXT, 58 polygons across 9 distinct types. Soil descriptions are standard pedology, not the source's; the classification and its extent are the source's.
Why the good soil is where it is
The geology layer maps 381 polygons across nine geological eras, each carrying a rock description. Read alongside the soil layer above, it answers the question the soil map raises: where does the fertile third come from?
91 basalt polygons — the province's whole economy in one rock
91 of the 381 polygons are basalt or basaltic plateau deposit — nearly a quarter of the map. Basalt weathers to the deep red clay soils that hold water and nutrients, which is why Mondulkiri grows coffee, rubber, pepper and cashew at all, why Vietnam's Central Highlands just across the border grow the same crops, and why the economic land concessions sit where they sit. The high-productivity soil is not distributed by chance; it is a map of old lava.
Provincial GIS layer 34, DESCRIPTIO containing “basalt”, counted by the service. Three distinct units appear: Basalt (symbol b, Prior-Quaternary), Basalt (ba, era unrecorded) and Basaltic plateau deposits (Pi, Quaternary).
Nine eras, and one of them is “Unknown”
The eras recorded are Ante-Cambrian, Devonian-Carboniferous, Permian, Triassic, Lower-Middle Jurassic, Jurassic-Cretaceous, Prior-Quaternary, Quaternary — and “Unknown geologic era”, which includes some of the basalt itself and a class frankly labelled “No Classified rock”. The bedrock beneath the province's most economically important soil is, in part, not dated in its own survey.
Provincial GIS layer 34, distinct values of ERA. Spellings (“Cretaeous”, “Quaternatry”) are the source's own and left as found.
And a second geology layer, 27 times finer
Layer 35 maps the same subject at far higher resolution: 10,397 polygons against layer 34's 381, with the same fields. It is the detailed survey to layer 34's overview. Its honesty is worth noting — 1,364 polygons, 13% of it, are classed “No Classified rock” in an “Unknown geologic era”. A finer map has not meant a more complete one; it has meant the gaps are mapped at higher resolution too.
Provincial GIS layer 35, counted by the service. Same AREA defect as layer 34, so polygon counts rather than areas are quoted.
Source: Mondulkiri provincial GIS, FeatureServer layer 34 (geology). We are publishing polygon counts rather than areas here: as with the soil layer, this table's AREA field carries values from the national survey it was cut from, and the largest single “Water” polygon alone claims 17,239,684,857 m² — larger than the province. The clipped geometry would have to be summed per era to give real areas, and we have not yet done that.
A third of the province is good soil — and everything is built on that third
The soil fertility layer divides Mondulkiri into three productivity classes covering 1,366,378 ha, or 95.6% of the province. The split explains a great deal about where people, plantations and concessions actually are.
Soil productivity, by area
The high-productivity third is the basalt belt — the same red volcanic soil that carries the coffee, rubber and cashew, and the same ground the concessions sit on.
Provincial GIS layer 32, areas computed from the clipped polygon geometry. The three classes sum to 1,366,378 ha = 95.6% of the province; the balance is water and unclassified ground.
Do not quote this layer's HECTARES column
The table carries a HECTARES field, and it is the obvious one to read. Its three values sum to 17,930,256 ha — roughly the whole of Cambodia, and twelve and a half times the size of Mondulkiri. They are the areas of the original national soil polygons, carried over unchanged when the layer was clipped to the province. The real provincial areas have to be computed from the clipped geometry, which is what the figures above do.
Provincial GIS layer 32, fields HECTARES against Shape__Area. This is a live trap in an otherwise useful layer.
61% low, and that is the forest
834,102 ha — 61% of the classified province is low-productivity soil. That is not a failing; it is the reason so much of Mondulkiri is still forest rather than farmland, and it is why the protected estate could be drawn at the scale it was. Land that will not pay to clear is land that survives. It also means the competition for the good third — between smallholders, concessions and indigenous communal claims — is much sharper than a province-wide land-per-person figure would suggest.
Derived from provincial GIS layer 32. The interpretive link between poor soil and surviving forest is ours, not the source's.
The rivers, ranked — and a surprise at the top
Fifteen rivers are named in the major-river layer, each with its Khmer name and its mapped length. Sorted by how much of each actually runs through Mondulkiri, the ordering is not the one the province's reputation would suggest.
| River | Mapped length |
|---|---|
| Prek Chbar | 148.7 km |
| Prek Rouei | 144.2 km |
| Prek Te | 134.7 km |
| Prek Tramet | 91.7 km |
| Prek Khtong | 67.6 km |
| Prek Chhlong | 66.4 km |
| Sre Pok (Srepok) | 62.7 km |
| Prek Preah | 51.3 km |
| Prek Krieng | 50.0 km |
| Dak Dam | 46.6 km |
The Srepok is only the seventh-longest reach here
The Srepok gives its name to a 374,053 ha wildlife sanctuary and to the whole eastern landscape, so it is easy to assume it dominates the province's drainage. It does not. Only 62.7 km of it is mapped inside Mondulkiri — less than half the 148.7 km of Prek Chbar, and behind Prek Rouei and Prek Te as well. The Srepok is a great river that mostly runs elsewhere; Mondulkiri holds a stretch of it, not the length of it.
Provincial GIS layer 26, field Shape_Leng in metres. 15 named rivers; lengths are the mapped reach within this dataset's extent.
3,582 stream segments beneath them
Below the named rivers the stream layer holds 3,582 line segments — the small watercourses that carry most of the province's water and that the 390 named waters attach to. This is the drainage that makes Mondulkiri a province of many small catchments rather than a few large ones, and it is why irrigation here is built village by village.
Provincial GIS layer 25 (stream lines). Layer 27 holds the major rivers as polygons, but its AREA field carries the same national-extent defect as the soil and geology tables — a single value of 11,864,959,909 m² repeated on every row — so no area is quoted from it.
390 named waters, and what their names tell you
One of the quietest layers in the database is also one of the most revealing: 625 label points carrying 390 distinct named water features, each with both its Khmer name and a romanisation. That is 2.7 named waters for every 100 km² of Mondulkiri — a density that says more about how the province is actually inhabited than any population figure does. People name what they use.
| Prefix | Means | Labels | Share |
|---|---|---|---|
| Ou … (អូរ) | stream, brook | 277 | 44% |
| Preaek … (ព្រែក) | creek, watercourse | 150 | 24% |
| Trapeang … (ត្រពាំង) | pond, waterhole | 77 | 12% |
| Other terms | rivers (Tonle), lakes, unclassified | 121 | 19% |
| Total label points | 625 | 390 distinct names | |
This is a province of small waters
Two thirds of every named feature is an Ou or a Preaek — a stream or a creek, not a river. Only a handful carry Tonle, the term for a substantial river, the Srepok among them. Mondulkiri's water is dispersed across hundreds of small courses rather than concentrated in a few large ones, which is exactly why irrigation here is a village-scale problem and why the Srae Huy scheme is treated as significant at the size it is.
Provincial GIS layer 24, field ROMAN_NAME, counted by prefix.
77 named ponds — a Bunong map in Khmer script
77 Trapeang — ponds and waterholes — are individually named and mapped. A pond gets a name because it is a landmark, a water source, or a place animals gather; in the Eastern Plains these are the seasonal waterholes that concentrate wildlife in the dry season, and the same features underpin both grazing and the elephant and banteng populations. The layer carries the Khmer original alongside every romanisation, so the names survive transliteration.
Provincial GIS layer 24, fields KHMER_NAME and ROMAN_NAME.
Source: Mondulkiri provincial GIS, FeatureServer layer 24 (hydrology stream names). Prefix counts are over all 625 label points; the same feature can carry more than one label, which is why the distinct-name count is 390. A named-feature density of 2.7 per 100 km² is our calculation against the province's 14,288 km².
The grid, as far as the database knows it
Two layers hold Mondulkiri's electricity transmission lines, and between them they contain three line segments totalling 218 km. That is the entire grid as this database records it — for a province of 14,288 km².
157 km of line with no voltage attached to it
The main transmission layer holds two segments — 73.7 km and 83.3 km — and carries no other information whatsoever. Its only fields are an Id (zero for both) and the geometry length. No voltage, no status, no owner, no date of energisation. You can draw these lines on a map; you cannot say what they are.
Provincial GIS layer 19, “Power Transmission Lines (PPWS)”. Field list read directly from the service.
The one line with details is not built
The second layer holds a single 61.3 km segment, and this one does carry detail: 115 kV, status “Under Study”, sourced to power-sector papers from 2009–2011. So the only transmission line in the database with a stated voltage is a proposal that has been under study for well over a decade — and it is 28% of all the line geometry here.
Provincial GIS layer 20, fields Size_Kv_, STATUS, References.
Source: Mondulkiri provincial GIS, FeatureServer layers 19 and 20. Read together with the 14,120 connected households figure elsewhere on this page, the picture is consistent: a small grid around Sen Monorom and the national road, and a large majority of the province served by off-grid solar, small diesel or nothing at all — but the GIS cannot confirm that, because it does not describe the lines it holds.
The road layer, and why we are not quoting a road length
The provincial GIS holds a road layer from the Provincial Department of Public Works and Transport, dated 2017: 240 line segments, each with a road name, a type and a status. It is the obvious source for a headline like “Mondulkiri has X km of road”. We are not going to give you that number, and the reason is worth more than the number would have been.
180 of 240 segments are marked “Deleted”
Three quarters of the layer — 180 segments — carry the road type “Deleted”. They still hold geometry, so anything that sums the layer's line lengths without filtering will produce a road network that is roughly four times the real one. Only 46 segments describe a built road: 33 Provincial Road, 7 National Road, 5 “Other road” and a single one classed Rural.
Provincial GIS layer 21, field Road_type, counted by the service: Deleted 180 · Provincial 33 · Plan 13 · NR 7 · Other 5 · Rural 1 · Planned Repairing 1 = 240.
One rural road segment in the largest province in Cambodia
Exactly one segment in the whole layer is classified Rural. In a province of 1.43 million hectares where most people live in villages off the national road, that is not a description of the countryside — it is a description of what the mapping exercise covered. The rural network is the part of Mondulkiri's transport system this database does not see, and it is the part that decides whether a village can get a crop or a patient out in the wet season.
Provincial GIS layer 21. Fourteen further segments are Plan Road or Planned Repairing — proposals, not surface.
Source: Mondulkiri provincial GIS, FeatureServer layer 21 (PDPWTP 2017). We have deliberately published the composition of the layer rather than a derived kilometre total: with three quarters of the records flagged Deleted and the rural network essentially unmapped, any single length figure drawn from it would be confidently wrong, and would be quoted long after the caveat was lost.
◆ Open buffer — roads
Reserved for a cleaned road centreline with surface type and condition, the rural/commune road inventory, and anything showing which roads are passable in the wet season.
Eleven dams on paper, none in the ground
The provincial GIS carries a hydropower layer with investor, capacity, expected annual generation, district, commune and project status for each site. Eleven Mondulkiri dams appear in it, together 104 MW and 630 GWh a year. Not one is built. Not one is under construction. Every single site is either Under study or Potential site, and every one traces back to the same origin: a 2003 identification exercise by the then Ministry of Industry, Mines and Energy.
| Site | District | Commune | MW | GWh/yr | Status |
|---|---|---|---|---|---|
| Prek Ter I | Keo Seima | Me Mang | 17.0 | 115 | Potential site |
| Prek Por I | Ou Reang | Dak Dam | 17.0 | 90 | Under study |
| Upper Prek Ter | Ou Reang | Sen Monorom | 15.0 | 77 | Potential site |
| Prek Ter II | Keo Seima | Chong Phlah | 10.0 | 66 | Potential site |
| Prek Por III | Pechreada | Krang Teh | 9.0 | 59 | Under study |
| Prek Por II | Pechreada | Krang Teh | 8.0 | 55 | Under study |
| Prek Rwei I | Pechreada | Bousra | 7.0 | 36 | Potential site |
| O Phlai IV | Kaoh Nheaek | Sre Sangkom | 7.0 | 47 | Under study |
| O Phlai I | Ou Reang | Dak Dam | 5.0 | 27 | Under study |
| O Phlai III | Pechreada | Krang Teh | 5.0 | 31 | Under study |
| O Phlai II | Pechreada | Sre Ampum | 4.0 | 27 | Under study |
| Total | Ou Reang 37 MW · Pechreada 33 · Keo Seima 27 · Kaoh Nheaek 7 | 104.0 | 630 | none operational | |
Three communes carry most of it — and two of them are tourism country
Krang Teh holds three sites totalling 22 MW. Dak Dam holds two totalling 22 MW — the same Dak Dam that carries the province's community homestays. And Prek Rwei I, 7 MW, sits in Bousra commune, home of the province's best-known waterfall and the single biggest draw in the tourism master plan. Sen Monorom commune has a 15 MW site of its own. None of the planning documents on this site addresses that overlap in either direction.
Provincial GIS layer 23, grouped by commune. All are “Under study” or “Potential site” — none is approved or financed.
No developer, no financier, no EIA
The layer carries dedicated investor, country, eia_date and eia_status fields. For all eleven Mondulkiri sites, every one of those four reads “Not found”. So there is no identified developer, no identified financing country and no environmental assessment on record for any dam in this province — consistent with none having advanced past study in twenty-two years.
Provincial GIS layer 23. Records last updated June 2015; the cited references are MIME/MME power-development papers from 2009–2011.
Source: Mondulkiri provincial GIS, FeatureServer layer 23 (hydropower dams). This is now the complete Mondulkiri set — the service reports exactly 11 records for province = ‘Mondul Kiri’, and all 11 are listed above. Capacities sum to 104.0 MW and generation to 630 GWh/yr. Sites in the same layer belonging to other provinces, such as Prek Rwei II in Ratanakiri’s Lumphat district, are excluded.
◆ Open buffer — energy
Reserved for the remaining pages of the hydropower layer, any post-2015 status changes, grid extension plans, and the solar/off-grid split that the sub-national investment plans omit.
A power station that never happened, and three dots with no names
Two of the layers this Atlas had read but never drawn. Neither is large — thirteen points and three points — but between them they correct a figure published here and put names on data that had none.
Thirteen sites, 114 MW, and not one of them exists
This Atlas has been reporting eleven hydropower sites totalling 104 MW, taking the count from the layer’s own province field. Testing each point against the district polygons instead finds thirteen sites inside Mondulkiri, totalling 114 MW. Two — Prek Rwei II and Prek Chbar — are filed under Ratanak Kiri but fall 9.3 km and 11.6 km inside Kaoh Nheaek. That is far too deep to be a boundary-generalisation artefact.
Both misfiled records give their district as “Lumphat” and their commune as “Chey Oddam”. Lumphat is a district of Ratanakiri and a wildlife sanctuary that straddles both provinces, so the likeliest explanation is that whoever populated the field reached for the sanctuary name. That is a hypothesis, not a finding; what is certain is where the coordinates fall.
| Site | Capacity | GWh/yr | Status | District, by geometry | Province, as filed |
|---|---|---|---|---|---|
| Prek Ter I | 17 MW | 115 | Potential site | Kaev Seima | Mondul Kiri |
| Prek Por I | 17 MW | 90 | Under study | Pechreada | Mondul Kiri |
| Upper Prek Ter | 15 MW | 77 | Potential site | Ou Reang | Mondul Kiri |
| Prek Ter II | 10 MW | 66 | Potential site | Kaev Seima | Mondul Kiri |
| Prek Por III | 9 MW | 59 | Under study | Pechreada | Mondul Kiri |
| Prek Por II | 8 MW | 55 | Under study | Pechreada | Mondul Kiri |
| Prek Rwei I | 7 MW | 36 | Potential site | Pechreada | Mondul Kiri |
| O Phlai IV | 7 MW | 47 | Under study | Pechreada | Mondul Kiri |
| Prek Rwei II | 5 MW | 31 | Potential site | Kaoh Nheaek | Ratanak Kiri |
| O Phlai III | 5 MW | 31 | Under study | Pechreada | Mondul Kiri |
| O Phlai I | 5 MW | 27 | Under study | Ou Reang | Mondul Kiri |
| Prek Chbar | 5 MW | 32 | Potential site | Kaoh Nheaek | Ratanak Kiri |
| O Phlai II | 4 MW | 27 | Under study | Pechreada | Mondul Kiri |
| Total | 114 MW | 693 | None built. | ||
Seven are “Under study”, six are “Potential site”, and every one traces back to a single 2003 Ministry of Industry, Mines and Energy list. No investor, no financier, no EIA date and no EIA status is recorded for any of them, and the whole layer was last touched in June 2015. Read plainly: this is a decade-old wish list, not a pipeline.
The border layer has no attributes at all
Layer 6 holds three points. Its entire attribute table is an OBJECTID and an Id column that is zero for every record. No name, no type, no status, no country. The Spatial Plan (p83) names four crossings along the province’s 312 km of border with Vietnam and states the district of each, but publishes no coordinates. Joining the two on the district each point actually falls in gives named coordinates for three, and identifies exactly which one the GIS is missing.
- La Pha Khe — Kaev Seima district, major. Sits 0.57 km outside the drawn district boundary, which is what a border post does.
- Dak Dam — Ou Reang district, major. Falls inside the district.
- Nam Lear — Pechreada district, under development. Sits 0.47 km outside the drawn district boundary, which is what a border post does.
- Kaoh Romyearl (Ji Meat) — Kaoh Nheaek district, unpaved road. In the Plan, absent from the GIS.
Derived · layers 23 and 6 of MDKPSPDATABASE, each point tested against the district polygons of layer 2. Crossing names from the Provincial Spatial Plan 2020–2040, p83, matched on district. Capacity and status are the layer’s own.
Boundaries are indicative only. The line shown between Mondulkiri and Viet Nam is drawn from a simplified provincial GIS layer and does not represent the international boundary. Delimitation and demarcation of that boundary are matters for the Royal Government of Cambodia and the Government of Viet Nam; only maps published under their authority are official.ព្រំដែនដែលបង្ហាញ ជាការប្រមាណប៉ុណ្ណោះ។ ខ្សែរវាងខេត្តមណ្ឌលគិរី និងប្រទេសវៀតណាម មិនមែនជាព្រំដែនអន្តរជាតិផ្លូវការទេ។ មានតែផែនទីដែលបោះពុម្ពដោយអាជ្ញាធររដ្ឋប៉ុណ្ណោះ ដែលមានលក្ខណៈផ្លូវការ។
Mining, licence by licence
This Atlas previously recorded the mining footprint as a flagged gap — licensed area was known, actual extraction was not. Layer 41 of the WWF database resolves it, with company names, mineral, licence type, status and expiry for 27 licence blocks.
Licensed ≠ mined
The distinction that matters, and that headline figures obscure.
WWF PSP Database layer 41 (PDPE, Sep 2017) · Verified
Only 1.6% of valid licence area is being extracted
Of 173,186 ha under valid licence, exploitation permits cover just 2,766 ha.
Rong Cheng Industrial Investment (gold, 2,758.8 ha) and RSPMK (sand, 7.3 ha) are the only exploitation permits recorded · Verified
| Company | Mineral | Licence | Area | Status / expiry |
|---|---|---|---|---|
| Alumina (Cambodia-Vietnam) | Bauxite | Exploration | 27,276.9 ha | Valid · Dec 2017 |
| Renaissance — Praek Klong | Gold | Exploration | 24,650.0 ha | Valid · Aug 2013 |
| Renaissance — Ou Stong | Gold | Exploration | 23,961.3 ha | Valid · Aug 2013 |
| Renaissance — O Khvav | Gold | Exploration | 19,200.9 ha | Valid · May 2017 |
| Angkor Gold Corp | Gold | Exploration | 18,900.0 ha | Valid · Jul 2020 |
| Renaissance — O Chhoung | Gold | Exploration | 18,200.0 ha | Valid · May 2017 |
| Anqing (Cambodia) Investment | Gold | Exploration | 17,660.0 ha | Valid · Nov 2018 |
| Jian Pu Zhai You Se Mining | Gold | Exploration | 15,000.0 ha | Valid · Aug 2017 |
| Cambodian Yu Fung Corp | Gold | Exploration | 5,530.0 ha | Valid · Aug 2017 |
| Rong Cheng Industrial Inv. | Gold | Exploitation | 2,758.8 ha | Valid · Feb 2021 |
| Chong Plas Community Mining | Gold | Artisanal | 41.2 ha | Valid · no end date |
| RSPMK | Sand | Exploitation | 7.3 ha | Valid · Mar 2018 |
| Alex Corporation | Bauxite | Exploration | 36,005.5 ha | Invalid |
| Poh Resources (2 blocks) | Gold | Exploration | 50,400.0 ha | Invalid · Dec 2016 |
| SS-DN Co Ltd | Gold | Exploration | 16,800.0 ha | Invalid · Feb 2015 |
| Heights Resolution Dev. | Bauxite | Exploration | 7,855.0 ha | Invalid |
| SEA Resource PTY | Metal | — | 19,825.2 ha | Not yet granted |
| Renaissance Minerals | Metal | — | 7,432.7 ha | Not yet granted |
| Sun Hill Minerals (3), Maxum Metals (3), Riva, Southern Gold | — | Exploration | area not recorded | Invalid |
The largest bauxite licence had already lapsed
This Atlas previously described Alex Corporation's 35,980 ha bauxite concession as the province's single largest mining licence, following the Provincial Spatial Plan. The GIS register gives it as 36,005.5 ha with status "Invalid". The area was right; the implication that it was live was not. Bauxite exploration in Ou Reang now rests with Alumina (Cambodia-Vietnam), 27,276.9 ha.
WWF PSP layer 41 vs Provincial Spatial Plan Table 7 · correction issued here
A community-run mine
Chong Plas Community Mining Enterprise holds the province's only artisanal gold licence — 41.2 ha in Chong Phlah commune, Kaev Seima, with no expiry date recorded. It is roughly 1/670th the size of the largest corporate block, and it is the only entry in the register held by a community rather than a company.
WWF PSP Database layer 41
"Valid" licences that had already expired
Four blocks are flagged Valid in a September 2017 dataset while carrying end dates of August 2013 (Renaissance Praek Klong, Ou Stong) and May 2017 (O Khvav, O Chhoung). Either the status field lags the expiry field, or renewals aren't reflected. Recorded as found — do not read "Valid" as "current" without checking with the Ministry of Mines and Energy.
WWF PSP layer 41, fields Status and Li_End
Total ever-licensed footprint
Adding valid, lapsed and pending blocks gives 311,505 ha — 21.8% of the province recorded as licensed at some point. That is substantially more than the 213,531 ha figure of January 2021 this Atlas cited, because it counts lapsed blocks. Both are true; they measure different things, which is precisely why the distinction matters.
Our aggregation of WWF PSP layer 41
The licence map, transcribed
The Atlas has been carrying an open gap for the mining licence boundaries: the layer existed in the provincial GIS but had never been read out. It has now been. Twenty-seven licence polygons are recorded, each with a company name, mineral, licence type, status and expiry — and reading them together changes the headline figure considerably.
12.1% of the province is under a live licence
Twelve licences carry status Valid, covering 173,186 ha — 12.1% of Mondulkiri's 1,428,800 ha. A further twelve are Invalid (lapsed or revoked) over 111,061 ha, and two more totalling 27,258 ha are marked not yet granted. Quoting the raw total of every polygon — 311,505 ha, or 21.8% — would overstate live extraction rights by nearly double.
Provincial GIS layer 41, fields Status and Hectares, summed by status.
This is a gold province with a bauxite problem
Gold accounts for 13 of the 19 substantive licences and 213,102 ha — 68% of all licensed ground. Bauxite is only 3 licences but 71,137 ha, because bauxite blocks are enormous. The single largest live licence in the province is Alumina (Cambodia-Vietnam) Co., Ltd — bauxite, 27,277 ha, status Valid.
Provincial GIS layer 41, field M_Type. Eight further records carry no mineral and zero hectares — see the note below.
| Company | Mineral | Status | Hectares |
|---|---|---|---|
| Alex Corporation | Bauxite | Invalid | 36,005.5 |
| Alumina (Cambodia-Vietnam) Co., Ltd | Bauxite | Valid | 27,276.9 |
| Poh Resources (Cambodia) Ltd | Gold | Invalid | 25,200.0 |
| Poh Resources (Cambodia) Ltd (duplicate polygon) | Gold | Invalid | 25,200.0 |
| Renaissance — Praek Klong | Gold | Valid | 24,650.0 |
| Renaissance — Ou Stong | Gold | Valid | 23,961.3 |
| SEA Resource PTY | Metal | Not yet granted | 19,825.2 |
| Renaissance — O Khvav | Gold | Valid | 19,200.9 |
| Angkor Gold Corp (Cambodia) Co., Ltd | Gold | Valid | 18,900.0 |
| Renaissance — O Chhoung | Gold | Valid | 18,200.0 |
| Anqing (Cambodia) Investment Company | Gold | Valid | 17,660.0 |
| SS-DN Co., Ltd | Gold | Invalid | 16,800.0 |
| Jian Pu Zhai You Se Mining Co., Ltd | Gold | Valid | 15,000.0 |
| Heights Resolution Development Co., Ltd | Bauxite | Invalid | 7,855.0 |
| Renaissance Minerals | Metal | Not yet granted | 7,432.7 |
| Cambodian Yu Fung Corporation (Group) | Gold | Valid | 5,530.0 |
| Rong Cheng Industrial Investment | Gold | Valid | 2,758.8 |
| Chong Plas Community Mining Enterprise | Gold | Valid | 41.2 |
| RSPMK | Sand | Valid | 7.3 |
| Live (Valid) licences only — 12 of them | 173,186.4 | ||
Three things this table will not let you do by accident. First, Poh Resources appears twice with byte-identical 25,200 ha polygons, so any naive sum double-counts 25,200 ha; de-duplicated, all records come to 286,305 ha rather than 311,505 ha. Second, eight records are empty shells — Riva Natural Resources, Sun Hill Minerals (×3), Maxum Metals (×3) and Southern Gold all carry no mineral, no area and mostly status Invalid; they are names retained in the register, not ground under licence. Third, one entry is not a company at all: Chong Plas Community Mining Enterprise, 41.2 ha of Valid gold licence — the only community-held mining title in the province, and roughly one six-hundredth the size of the largest corporate block.
Source: Mondulkiri provincial GIS, FeatureServer layer 41 (PDPE, Sep 2017). Status counts: Valid 12 · Invalid 12 · not yet granted 2 · blank 1 = 27. Note this GIS figure of 173,186 ha of live licence area sits below the 213,531 ha register total of January 2021 elsewhere on this page — the two are measuring different things (mapped boundaries against register entries) and at different dates, and we have not reconciled them.
Boundaries are indicative only. The line shown between Mondulkiri and Viet Nam is drawn from a simplified provincial GIS layer and does not represent the international boundary. Delimitation and demarcation of that boundary are matters for the Royal Government of Cambodia and the Government of Viet Nam; only maps published under their authority are official.ព្រំដែនដែលបង្ហាញ ជាការប្រមាណប៉ុណ្ណោះ។ ខ្សែរវាងខេត្តមណ្ឌលគិរី និងប្រទេសវៀតណាម មិនមែនជាព្រំដែនអន្តរជាតិផ្លូវការទេ។ មានតែផែនទីដែលបោះពុម្ពដោយអាជ្ញាធររដ្ឋប៉ុណ្ណោះ ដែលមានលក្ខណៈផ្លូវការ។
Provincial GIS layer 41, geometry generalised to ~0.02°. Records with zero hectares carry no boundary and are absent. The lapsed blocks are as large as the live ones — this is a map of what has been claimed, not what is worked.
The national register, and a province with two spellings
Verified Source: Mining concessions in Cambodia (1995–2022), Open Development Cambodia, 307 records nationally, licensed CC BY 4.0.
Every query this Atlas ran against that register for “Mondulkiri” came back empty. The register spells it “Mondul Kiri”, two words. That is worth recording on its own: a province with two spellings is a province that quietly goes missing from searches, including from the searches of anyone else trying to audit it.
Spelled correctly, the register holds 43 licence records touching this province between 1995 and 2022, against the 27 blocks the provincial GIS carries at September 2017. It names directors, addresses and company websites, none of which the GIS layer has.
647,185 hectares — and why you must not quote it
The 24 records that carry an area sum to 647,185 ha, forty-seven percent of the province. That number is real and it is not a mining footprint. It is a cumulative historical register: lapsed licences, superseded blocks, overlapping grants and at least one outright duplicate, each counted once. The figure to quote for live licensed area remains the GIS’s 163,586 ha. A further 17 records carry no area at all.
The register also disagrees with itself. Anging (Cambodia) Invest Company Co. Ltd. and Anquing Cambodia Investment Company both appear at exactly 21,600 ha — two transliterations of Anqing, almost certainly one licence entered twice.
Six holders the provincial GIS does not name
Among them BHP Billiton and an aluminium venture with a larger recorded area than any block in the provincial layer.
| Licence holder | Area in the register |
|---|---|
| Allumina (Cambodia Vietnam) Co. Ltd. | 125,400 ha |
| BHP Billiton World Exploration Inc | 99,600 ha |
| Maxum Metals Pty Ltd (Trasol Corporation) | 86,600 ha |
| Oz Minerals and Shin Ha Mining Company | 43,900 ha |
| C.I.I.D.G Erdos Hongjun Aluminum Industry Co. Ltd. | 36,000 ha |
| Angkor Gold Corp (Cambodia) Co., Ltd. | 18,900 ha |
Activity after September 2017, at last
This Atlas has recorded, as an open gap, that nothing was known about licence activity after the provincial layer’s September 2017 date. One record closes part of it: Renaissance Minerals (Cambodia) Limited, area O'Ktung in Keo Seima district, 19,520 ha — status line dated 23 March 2020 — government selected as a candidate for an exploration licence. That is three years past the GIS snapshot, and it shows the ground in and around Keo Seima still moving through the licensing process.
◆ Open buffer — mining & extractives
Reserved for newer MME licence registers, EIA documents, royalty records, or community impact reports. The licence layer above is dated September 2017; anything granted, renewed or revoked since then belongs here.
Who is growing, and who holds the land
Two more layers drawn for the first time. The first records how each commune's population changed between 2006 and 2016 — the only decade-scale, commune-level population series that exists for this province. The second puts the three competing forms of land holding on one frame, which is the only way to see how unequal they are.
Boundaries are indicative only. The line shown between Mondulkiri and Viet Nam is drawn from a simplified provincial GIS layer and does not represent the international boundary. Delimitation and demarcation of that boundary are matters for the Royal Government of Cambodia and the Government of Viet Nam; only maps published under their authority are official.ព្រំដែនដែលបង្ហាញ ជាការប្រមាណប៉ុណ្ណោះ។ ខ្សែរវាងខេត្តមណ្ឌលគិរី និងប្រទេសវៀតណាម មិនមែនជាព្រំដែនអន្តរជាតិផ្លូវការទេ។ មានតែផែនទីដែលបោះពុម្ពដោយអាជ្ញាធររដ្ឋប៉ុណ្ណោះ ដែលមានលក្ខណៈផ្លូវការ។
| Commune | District | 2006 | 2016 | Growth / yr |
|---|---|---|---|---|
| Pu Chrey | Pechreada | 2,735 | 7,352 | 9.89% |
| Srae Huy | Kaoh Nheaek | 1,407 | 2,568 | 6.02% |
| Rummeaknea | Saen Meaknourum | 3,257 | 5,791 | 5.75% |
| Srae Khtum | Kaev Seima | 6,139 | 10,754 | 5.61% |
| Bu Sra | Pechreada | 3,557 | 6,040 | 5.29% |
| … | ||||
| A Buon Leu | Kaoh Nheaek | 1,506 | 1,814 | 1.86% |
| Saen Meaknourum | Ou Reang | 2,674 | 3,354 | 2.27% |
| Nang Khi Lik | Kaoh Nheaek | 2,749 | 3,623 | 2.76% |
| All 20 communes with data | 49,530 | 78,803 | ||
A commune whose people are missing from the layer
Layer 4 has 21 rows for 21 communes, so at a glance it looks complete. It is not. Two of the rows are byte-for-byte identical — same name, same 381.23 km², same 2,674 people in 2006, same 3,354 in 2016, same growth rate. Both belong to Ou Reang district, which has two communes. One of them has been given a copy of the other's record.
- Dak Dam has no population figures in this layer at all. Its 46,875 ha are on the map; its people are not in the table.
- Summing the layer as delivered gives 82,157 for 2016 — a figure that double-counts one commune and omits another. The honest total across the 20 unique rows is 78,803, and it is short by one commune.
- The area on the duplicated row matches neither polygon. It records 381.23 km²; the two Ou Reang communes measure roughly 788 km² and 469 km² on the ground.
- Four sangkats of Saen Meaknourum city record zero villages, which is why a village count summed from this layer comes to 73 rather than the province's 90.
Boundaries are indicative only. The line shown between Mondulkiri and Viet Nam is drawn from a simplified provincial GIS layer and does not represent the international boundary. Delimitation and demarcation of that boundary are matters for the Royal Government of Cambodia and the Government of Viet Nam; only maps published under their authority are official.ព្រំដែនដែលបង្ហាញ ជាការប្រមាណប៉ុណ្ណោះ។ ខ្សែរវាងខេត្តមណ្ឌលគិរី និងប្រទេសវៀតណាម មិនមែនជាព្រំដែនអន្តរជាតិផ្លូវការទេ។ មានតែផែនទីដែលបោះពុម្ពដោយអាជ្ញាធររដ្ឋប៉ុណ្ណោះ ដែលមានលក្ខណៈផ្លូវការ។
Derived · 227 of the 287 titled parcels — 79% — are in Kaev Seima district. Four of Mondulkiri's five districts have either one titled community or none. Set against 23 concession blocks spread across the whole province, the map shows an asymmetry that the hectare figures alone understate: concession land is provincial, titled indigenous land is local to one corner.
The Master Plan set a destination. This is the road so far.
Verified Reported Derived Sources are given per row in the table. The 2035 targets are from the Master Plan for Mondulkiri Tourism Development 2021–2035; the 2017 baseline is from the Provincial Spatial Plan 2021–2040; the outturn figures are from the Mondulkiri Provincial Department of Tourism and from the deputy provincial governor, reported in the press; the national comparisons are from the Ministry of Tourism’s own statistics report.
This Atlas has been publishing the Master Plan’s targets — 900,000 international visitors and two million domestic by 2035 — since the Plan was extracted. Targets without an outturn are advertising. Here is every arrival figure that can be traced to a named authority, and what those targets therefore require.
Every figure, with its source and its working
| Period | Span | Total | Domestic | International | Intl share | Tier | Source and working |
|---|---|---|---|---|---|---|---|
| 2017 | full year | 114,349 | 102,590 | 11,759 | 10.28% | Verified | Mondulkiri Provincial Spatial Plan 2021-2040, tourism section Up 14% on 2013. Counted across 15 recognised attraction sites. |
| 2022 | Jan-Jun | 224,656 | 222,795 | 1,807 | 0.80% | Derived | Derived from the 2023 half-year percentages below H1 2023 is reported as -23.3% on H1 2022 overall, -24% domestic, +65% foreign. Reversing each gives this row. |
| 2023 | Jan-Jun | 172,311 | 169,324 | 2,982 | 1.73% | Reported | Mondulkiri Provincial Department of Tourism, via Phnom Penh Post, 27 Aug 2023 Reported as -23.3% year on year: domestic -24%, foreign +65%. |
| 2024 | January only | 51,954 | 51,322 | 632 | 1.22% | Reported | Mondulkiri Provincial Department of Tourism, via Khmer Times Only the domestic figure was published; the foreign count is the remainder. |
| 2024 | full year | 406,000 | 400,000 | 6,000 | 1.48% | Reported | Ngin Sovimean, deputy provincial governor, via Phnom Penh Post, 14 Feb 2025 Stated as 'more than 400,000' domestic and foreign 'only just topped 6,000'. Both are floors, so the total is a floor too. |
| 2035 | plan target | 2,900,000 | 2,000,000 | 900,000 | 31.03% | Verified | Master Plan for Mondulkiri Tourism Development 2021-2035 Adopted 2022. Also targets 80,000 jobs and $500M direct income, $1bn total at a stated multiplier of 2.75. |
Where the one derived row comes from
The 2022 half-year was never published as a number. It was published as three percentages: the 2023 half-year was reported as −23.3% overall, −24% domestic and +65% foreign. Reversing each one separately gives 224,656 total, 222,795 domestic and 1,807 foreign.
That reversal is only trustworthy because of what happens next: the two reversed parts add to 54 visitors away from the reversed total — 0.024% apart. Three independently rounded percentages had no obligation to agree that closely. They do, which is the evidence that the arithmetic is sound. The row is still marked Derived and drawn faint, because it is arithmetic and not a measurement.
Is 57.7% a year a lot?
A growth rate means nothing without a yardstick, so here is one. Cambodia took international arrivals from 118,183 in 1993 to 6,610,592 in 2019 — the entire post-war tourism boom, Angkor and the coast included, twenty-six years of it. That is 16.7% a year.
To reach 900,000 international visitors by 2035 from roughly 6,000 in 2024, Mondulkiri needs to grow international arrivals about 3.4 times faster than that, and hold it for eleven straight years. The domestic target, by contrast, needs 15.8% a year, which is demanding but not extraordinary — the province has been running at roughly that pace already.
The honest conclusion is not “the plan will fail”. It is narrower and firmer than that: the domestic half of the target is within reach and the international half is not, on any trajectory the record so far supports. The two should stop being quoted as one number.
The national market is going the other way
The Ministry of Tourism’s own figures for the period the plan is running through: Cambodia received 5,569,752 international visitors in 2025, -16.9% down on 2024. The first quarter of 2026 brought 1,014,147, -44.8% down on the same quarter of 2025 and -46% below the 2019 quarter. Mondulkiri’s international target requires the steepest sustained climb in the province’s history to begin during a national contraction.
One further reference point, offered with a caveat. The Ministry reports internal tourism by destination region, and Mondulkiri sits in its Eco-tourism Zone. That whole zone drew 15,604 foreign visitors in the first quarter of 2026, -4.3% on the year before, against 137,861 Cambodian visitors, +9.9%. The report does not state which provinces the zone contains, so this is not a Mondulkiri figure — but it caps how large one plausibly is, and it points the same way: domestic up, foreign down.
What the one visible decline was blamed on
The series contains one clear fall — the 2023 half-year, -23.3% down on 2022. It is worth recording why, because the reasons are structural rather than one bad season, and none of them has been reversed.
- The Phnom Penh-Sihanoukville Expressway opened — Day trips to nearer places replaced overnight trips east.
- Economic downturn — Households chose closer destinations over costlier long trips.
- Road condition — The national road into the province was cut for a period by flooding.
Sim Dimanche, general manager, Avocado Guesthouse, Sen Monorom recorded a 50% year-on-year drop in guests over the same period (Phnom Penh Post, 27 Aug 2023). Seang Soeun, director, Mondulkiri Provincial Department of Tourism attributed the fall to the Russia-Ukraine war and the 2023 national election. Both explanations are recorded; neither is endorsed here. Note that foreign arrivals rose 65% in that same half-year while domestic fell 24% — whatever drove the fall, it was a domestic-market effect.
How many tourism sites does Mondulkiri have? Three official answers.
Verified Reported Sources: Mondulkiri Provincial Spatial Plan 2021–2040 (text and GIS layer 7); Ngin Sovimean, deputy provincial governor, interviewed in the Phnom Penh Post, 14 February 2025.
The Visitor Guide already carries two of these counts and the gap between them. A third has since appeared, from the provincial administration itself, and it is seven times the first. All three are printed here rather than averaged, because the spread is the finding: nobody is maintaining a register.
| Count | Who says so | What is being counted | Tier |
|---|---|---|---|
| 15 | Provincial Spatial Plan 2021-2040, text | Recognised tourism attraction sites, classified by type and by operator. | Verified |
| 29 | Provincial Spatial Plan GIS database, layer 7 | Mapped points in the plan's own tourism layer. Eleven carry a Khmer name only. | Verified |
| 106 | Ngin Sovimean, deputy provincial governor, Feb 2025 | '106 individual tourism attractions', stated in an interview. No register published. | Reported |
These are not three attempts at the same measurement. 15 counts sites the province formally recognises, with an operator attached to each. 29 counts points somebody drew on a map. 106 counts places worth visiting, on a definition nobody has written down. A visitor wants the first, a planner needs the second, and the third is the only one that has ever been used in public to describe the province’s potential.
One of the eleven blanks can now be filled
GIS layer 7 carries eleven points with a Khmer name and no English one, which is why they never reach guidebooks. The Atlas listed them anyway. One of them — នាមលៀរ, transliterated Nam Lear — turns out to be the site the deputy governor calls Namlear Mountain, and he gives it a size: 24 hectares, named as one of the developments that lifted visitor numbers before the pandemic. Ten blanks left.
What is actually built
Set the last two cards against each other and the province’s position is legible in one line: roughly two thousand places to sleep, one developed attraction, and about six thousand foreign visitors a year. The constraint is not beds.
The airport the whole forecast rests on
The Master Plan’s international growth curve assumes an airport opening in 2023. The current state of that project: a site of 300–600 ha in Sen Monorom commune, Ou Reang district, costed at over $60 million, awarded to the FOCUS Consortium under Notification No. 41 of the NCC, dated 9 January 2024, with a feasibility study started in March 2024. A previous Chinese partner withdrew, citing COVID-era finances. A feasibility study is not a runway. Every international figure in the Master Plan should be read against this line.
A smaller discrepancy, resolved
The same interview describes Mondulkiri as “one town, four districts, 17 communes and 92 villages”. This Atlas publishes 21 communes from the GIS boundaries, and both are right. Sen Monorom is a krong — a municipality — and its four urban quarters are sangkat, not khum. 17 rural communes plus 4 urban quarters is 21 commune-level units. The counts differ by exactly the number of sangkat, which is what a real reconciliation looks like as opposed to a coincidence.
Legal Register
The instruments that govern land, boundaries, protected areas and administration in Mondulkiri — and, more usefully, what each one actually establishes. The register is a finding aid, not the substance: where a document carries figures or rules that matter, those have been pulled out into the sections above and the summaries below. For the instruments that move a boundary rather than describe one — every sub-decree that has cut hectares out of the protected estate, and who received them — see The protected estate, cut by decree.
What the Spatial Plan 2020–2040 establishes
The provincial spatial plan is the single richest source on this province. It fixes the official area at 1,428,800 ha (14,288 km²) per Ministry of Interior records — while its own GIS database computes 13,715 km², a discrepancy the plan itself does not reconcile. It records five protected areas covering 925,835 ha, or 64.8% of the province, rising to 77.25% once biodiversity corridors are included, and classifies 89.8% of land as forestry and 9.8% as agriculture. It also documents 25 economic land concessions totalling 162,303 ha, of which seven (43,970 ha) sit inside protected areas, with rubber accounting for roughly half the concession area.
PCLMUP Mondul Kiri, Technical Report of the Provincial Spatial Plan 2020–2040 (WWF, 2021), Tables 1, 3, 4 and 7
What the Keo Seima designation changed
Sub-decree 69 (2016) converted Seima Protection Forest into Keo Seima Wildlife Sanctuary, 292,690 ha in total with 233,654 ha inside Mondulkiri — 16.3% of the province. Management sits with the Ministry of Environment alongside WCS under a 60-year agreement running to 2069, covering ~167,000 ha of dense protected forest plus a 297,000 ha buffer. At its 2010 baseline, 20 villages and roughly 2,500 families held recognised traditional forest-use rights inside it.
Sub-decree 69 (2016); WCS Seima REDD+ programme documentation, via the Provincial Spatial Plan
Mining licences: the number worth knowing
As of January 2021, 213,531 ha of Mondulkiri — around 15% of the province — sat under a mining licence, of which 18.2% was exploitation-stage and the remainder exploration. Gold exploration concentrates in Pechreada, Kaev Seima and Kaoh Nheaek; bauxite in Ou Reang, where the province's single largest licence (35,980 ha) is held. This figure is four years old at time of writing and no newer official total was located — treat it as a floor, not a current position.
Provincial Department of Mines and Energy, via the Provincial Spatial Plan 2021, Table 7
The 2026 district emblem Prakas
Four Prakas issued on the same day — 17 July 2026 — created official administrative emblems for Kaev Seima, Pechreada, Kaoh Nheaek and Ou Reang. Individually minor; together they mark a coordinated province-wide formalisation of district identity, and each is a four-page instrument available in full from the NCDD e-Library. No corresponding instrument for Sen Monorom municipality was located.
Prakas 8447, 8448, 8449 and 8450 — NCDD e-Library
Foundational chronology
The instruments that actually constitute Mondulkiri as a jurisdiction — where its borders came from, when it became a province, and what has been carved out of it since.
| Year | Instrument | Jurisdictional impact | Source |
|---|---|---|---|
| 1904 / 1907 | Franco-Siamese Conventions Foundational | Initial colonial boundary demarcation across the Haute Chhlong, separating the Cambodian protectorate from Annam and Cochinchina. Origin of today's ~314.66 km international frontier with Vietnam. | National Archives of Cambodia |
| 30 Dec 1961 | Royal Decree 46 Foundational | Formal creation of Mondulkiri Province under Sangkum Reastr Niyum, carved out of Kratié. Originally three districts — Kaoh Nheaek, Chba and Ou Reang; Sen Monorom became the municipal seat in 1962. | Royal Government of Cambodia; Provincial Spatial Plan 2021 |
| 1993 | Establishment of Phnom Prich Wildlife Sanctuary Conservation | 222,500 ha placed under protection — 15.6% of the province — sitting centrally between the Mondulkiri Protected Forest and Keo Seima. | Ministry of Environment; Protected Planet / WDPA |
| 2001 | Land Law Foundational | Statutory basis for Economic Land Concessions and for Indigenous Communal Land Titling — the legal instrument underlying both the 26 ELCs and the seven Collective Land Titles now granted in the province. | Royal Government of Cambodia |
| 17 Jun 2011 | Law on the Financial Regime & Property Management of Sub-National Administrations Administrative | Royal Kram NS/RKM/0611/011 — 8 chapters, 56 articles. Defines what a provincial or district administration may raise, hold, spend and own. The frame around every figure in Provincial Finance. | Royal Government of Cambodia |
| 1 Apr 2015 | Sub-Decree 42 on Urbanisation Administrative | Classification framework for capitals, municipalities and urban areas — the basis on which Sen Monorom is designated an urban centre. | Royal Government of Cambodia |
| 2016 | Sub-Decree 69 — Keo Seima Wildlife Sanctuary Conservation | Converted Seima Protection Forest into a Wildlife Sanctuary under the Ministry of Environment. 292,690 ha total, of which 233,654 ha lie in Mondulkiri (16.3% of the province). Underpins the WCS/USAID REDD+ carbon programme running to 2069. | Ministry of Environment; WCS Cambodia |
| 18 Feb 2021 | Adoption of the Provincial Spatial Plan 2021–2040 Administrative | First spatial plan in the province's history, approved by the Provincial Council. Drafting began January 2017 (EU-funded), ran from October 2018 under USAID support via WWF Cambodia. | Mondulkiri Provincial Council |
| 17 Jul 2026 | Prakas 8447 – 8450 — District administrative emblems Administrative | Four instruments issued the same day creating official emblems for Ou Reang (8447), Kaev Seima (8448), Kaoh Nheaek (8449) and Pechreada (8450). A coordinated province-wide formalisation of district identity. No corresponding instrument for Sen Monorom municipality has been located. | NCDD e-Library |
| — | ◆ Open row buffer. Reserved for additional user-supplied legal instruments: sub-decrees, prakas, provincial deika, ELC contracts, communal title certificates, boundary agreements. Duplicate this row or the pattern above to extend the register. | ||
Source documents
| Instrument Type | Title / Subject | Date | Source |
|---|---|---|---|
| Sub-Decree | Mondulkiri Provincial Spatial Plan 2021–2040 | 2021 | Ministry of Land Management |
| Royal Decree | Establishment of Keo Seima Wildlife Sanctuary | 2016 | Ministry of Environment |
| Prakas | Land Concession Registry, Mondulkiri Province | 2019 | General Department of Cadastre |
| Demographic Statistic | Provincial Population Count Disputed 2019 General Population Census records 92,213 residents; the Mondulkiri Provincial Department of Planning's 2023 working estimate cites 108,400. Reconciliation between the two figures is pending and both are shown until resolved. | 2019 / 2023 | NIS Census 2019; Provincial Dept. of Planning 2023 |
| Sub-Decree (ELC) | Economic Land Concession — Rubber Plantation, Bou Sra & Sen Monorom Districts | 2008 | Royal Government of Cambodia, Council of Ministers |
| Treaty | Franco-Siamese Boundary Convention, defining the province's historical eastern frontier | 1904 | National Archives of Cambodia |
| Open GIS Dataset | Cambodia Mondul Kiri Provincial Spatial Planning Database 39 layers, 467 MB, licensed "No Restrictions". Village centres, ELC and mining boundaries, land titles, protected-area zoning, soils, geology, hydrology, roads and power. Extracted in The provincial GIS database — where it reveals a 56,580 ha discrepancy against the official concession register. | 2018 (rev. 2020) | WWF, from multiple provincial & national sources |
| Statistical Report | Sub-National Statistics Results — Kratié, Stung Treng, Ratanakiri, Mondulkiri & Preah Vihear NIS benchmarking of the five north-eastern provinces on housing, agricultural equipment and living conditions. Extracted in How people actually live. | Dec 2020 | National Institute of Statistics, Ministry of Planning |
| National Inventory | Inventory of Rural Roads of the Kingdom of Cambodia (2014) Ministry of Rural Development register of the national rural road network and its supporting database. Held in the register as the authoritative baseline for rural road length; the Mondulkiri extract has not yet been transcribed. | 2014 | Ministry of Rural Development |
| Project Safeguard Doc | Cambodia Water Security Improvement Project (P176615) — ESMP, Srae Huy Subproject Rebuilds a weir broken since ~1980, expanding irrigation from 1,057 ha to 5,600 ha across Srae Huy and Roya communes. Extracted in Water & irrigation. | 2024–2030 | MOWRAM / MAFF, World Bank-financed |
| Project Safeguard Doc | LASED III — ESMP, Andoung Kraloeng Titled Indigenous Community Second documented village profile: 202 households, 796 people, 1,424.26 ha. Funds 3,975 m of laterite road and a five-classroom primary school. Extracted in the village profiles. | Jan 2024 | MLMUPC / MAFF, World Bank-financed |
| Valuation Study | Mapping and Valuing Ecosystem Services in Mondulkiri Prices the province's forest under three development paths to 2030. Business-as-usual costs $1.1bn in lost ecosystem services; NTFPs fall from 58% to 24% of household income. Extracted in What the forest is worth. | 2016 | WWF-Cambodia |
| District Data Book | Kaoh Nheaek District Data Book (District Code 1102) NCDD commune-database compilation for a single district: population, occupations, roads, agriculture, education, health, water and sanitation, land disputes, domestic violence, and ethnic-minority counts. Records 1,127 Phnong families in the district in 2008. | Oct 2009 | National Committee for Sub-National Democratic Development |
| Sub-Decree | Sub-decree 42 on Urbanisation of the Capital, Municipalities and Urban Areas — the framework used to classify Sen Monorom as an urban centre | 1 Apr 2015 | Royal Government of Cambodia |
| Law (Royal Kram) | Law on the Financial Regime and Property Management of Sub-National Administrations Royal Kram NS/RKM/0611/011. Eight chapters, 56 articles — the statute that defines what a provincial or district administration may raise, hold, spend and own. It is the legal frame around every budget figure in the Provincial Finance section above. | 17 Jun 2011 | Royal Government of Cambodia |
| Provincial Plan | Mondulkiri Provincial Tourism Master Plan 2021–2035 Adopted provincial tourism strategy: six strategic directions, priority zones, and quantified 2035 targets. Extracted in full on the Visitor Guide. | 2021 | Mondulkiri Provincial Administration / Ministry of Tourism |
| Council Decision | Adoption of the Mondulkiri Provincial Spatial Plan 2021–2040 Approved by the Provincial Council on 18 February 2021 — the first spatial plan in the province's history. Drafting began January 2017 with EU funding and ran from October 2018 under USAID support delivered through WWF Cambodia, following a final consultation workshop on 17 February 2021. | 18 Feb 2021 | Mondulkiri Provincial Council (joint press release) |
| Government Reference | Information Book on Capitals and Provinces of Cambodia — Mondulkiri profile The government's own provincial reference profile: population by census, age structure, governance composition, borders, soils, utilities and crop areas. Extracted into the Official Provincial Profile and Infrastructure sections. | 15 Mar 2024 | Ministry of Interior |
| Project Safeguard Doc | LASED III — Environmental & Social Management Plan, Cluster 9 (incl. Lam Meh village, Mondulkiri) Documents the communal land title issued to the Bunong community of Lam Meh, Bu Sra commune — 127 parcels over 2,532.29 ha. Extracted in the village-level profile. | 25 Nov 2025 | MLMUPC / MAFF, World Bank-financed |
| Budget Document | Mondulkiri Provincial Administration Budget, FY2025 — KHR 37,862 million (~US$9.3M) total expenditure, 100% recurrent / 0% capital investment allocated One of the few provinces with no capital/investment expenditure line budgeted for 2025 — flagged here rather than silently omitted. | 2025 | Ministry of Economy and Finance, Budget in Brief for Sub-National Administration FY2025 |
| Prakas | Prakas 8448/ប្រក — Creation and use of the official administrative emblem of Kaev Seima district | 17 Jul 2026 | NCDD Library (library.ncdd.gov.kh) |
| Prakas | Prakas 8450 — Creation and use of the official administrative emblem of Pechreada district | 17 Jul 2026 | NCDD Library (library.ncdd.gov.kh) |
| Prakas | Prakas 8449/ប្រក — Creation and use of the official administrative emblem of Kaoh Nheaek district | 17 Jul 2026 | NCDD Library (library.ncdd.gov.kh) |
| Prakas | Prakas 8447/ប្រក — Creation and use of the official administrative emblem of Ou Reang district | 17 Jul 2026 | NCDD Library (library.ncdd.gov.kh) |
All four district-level emblem Prakas were issued the same day (17 Jul 2026) — a coordinated province-wide rollout. Sen Monorom's own municipal emblem instrument was not found in this pass; the NCDD e-Library's search filter did not return targeted results at time of writing, so this list was assembled by direct inspection of the library's homepage feed rather than a full-text search — treat the absence of a fifth entry as a research gap, not confirmation none exists.
The protected estate, cut by decree
Verified Source: Open Development Cambodia, catalogued from the Royal Gazette and published through its open DataHub. ODC holds 71 legal records for this province; the 35 below are the ones that move a boundary. Retrieved 2026-08-11.
Everything else in this Atlas describes where Mondulkiri’s protected areas are. This describes them being cut. Cambodia excises land from protected forest one sub-decree at a time, and each instrument names its hectares, the forest it comes out of and who receives the result. Sorted by date, those instruments become a record that exists nowhere as a single document.
It is not only a story of loss
The obvious reading is a list of losses, and that reading is wrong. Sub-decrees 62, 239 and 250 cut a combined 1,582 ha out of Seima specifically to grant Pnong indigenous communal ownership to three communities totalling 196 families. Sub-decree 393 cut 3,521 ha and passed 3,134 ha of it to 750 families in 1,335 titled parcels. The instrument that hands forest to a rubber company is the same instrument that hands it to the people already living on it. Publishing only the total would misrepresent the record, so the chart is coloured by recipient.
Forty-eight hours in June 2011
Four sub-decrees dated 15 and 16 June 2011 reclassified 9,773, 9,656, 9,014 and 9,614 hectares — all in Rayor commune, Kaoh Nheaek district. That is 38,057 ha in one commune inside two days, and roughly 17% of the commune this Atlas measures at 220,853 ha. Each is a distinct instrument with a distinct area; none is a correction of another. None of the four names a recipient. It is visible only when the whole series is sorted by date, which is what this panel does.
Every instrument, in order
| Promulgated | Instrument | Area | Cut from | To |
|---|---|---|---|---|
| 1995-08-01 | Prakas 554 | — | Mining exploration licence, Memong area | SUNTRADING Co Ltd |
| 2002-07-30 | Sub-decree 75 | — | Establishes Mondulkiri Protected Forest for genetic resources, plants and wildlife | State |
| 2007-12-28 | Sub-decree 206 | — | Downsizes that same protected forest, five years after creating it | State |
| 2009-09-02 | Sub-decree 143 | — | Establishes Keo Seima protected forest and biodiversity conservation area | State |
| 2011-06-15 | Sub-decree (Rayor I) | 9,773 ha | Land in Rayor commune, Kaoh Nheaek | Not stated in the record |
| 2011-06-15 | Sub-decree (Rayor II) | 9,656 ha | Land in Rayor commune, Kaoh Nheaek | Not stated in the record |
| 2011-06-15 | Sub-decree (Rayor III) | 9,014 ha | Land in Rayor commune, Kaoh Nheaek | Not stated in the record |
| 2011-06-16 | Sub-decree (Rayor IV) | 9,614 ha | Land in Rayor commune, Kaoh Nheaek | Not stated in the record |
| 2011-07-22 | Sub-decree | 8,708 ha | Phnom Prich Wildlife Sanctuary, Kaev Seima district | Not stated in the record |
| 2012-02-28 | Sub-decree | 500 ha | Phnom Namlear Wildlife Sanctuary; abrogates Sub-decree 85 of 20 May 2011 | Not stated in the record |
| 2012-03-16 | Sub-decree | 6,892 ha | Phnom Prich Wildlife Sanctuary | Not stated in the record |
| 2012-06-07 | Sub-decree | 9,477 ha | Phnom Namlear Wildlife Sanctuary | Not stated in the record |
| 2012-09-14 | Sub-decree (amending 20) | 4,000 ha | Sen Monorom and Pechreada districts; amends Sub-decree 20 of 28 January 2011 | Not stated in the record |
| 2013-02-06 | Sub-decree 54 | 464 ha | ELCs and Conservation Protected Forest | Economic land concession |
| 2013-02-06 | Sub-decree 55 | 664 ha | ELCs and Conservation Protected Forest | Economic land concession |
| 2013-02-12 | Sub-decree 57 | 996 ha | Wildlife Sanctuary, ELCs, Conservation Protected Forest | Economic land concession |
| 2013-02-13 | Sub-decree 62 | 711 ha | Seima Biodiversity Protected Area | Pnong indigenous communal ownership, 72 families |
| 2013-05-11 | Sub-decree 231 | 1,300 ha | ELCs and Conservation Protected Forest | Economic land concession |
| 2013-05-16 | Sub-decree 239 | 359 ha | Seima Biodiversity Protected Area | Pnong indigenous communal ownership, 1 community, 31 families |
| 2013-05-18 | Sub-decree 250 | 512 ha | Snoul Wildlife Sanctuary, Seima Biodiversity Conservation, Forest Cover 2002 | Pnong indigenous communal ownership, 1 community, 93 families |
| 2013-06-07 | Sub-decree 338 | 142 ha | Conservation and Protected Forest, Forest Cover, ELCs, SLC | Mixed |
| 2013-06-07 | Sub-decree 339 | 4,728 ha | Conservation Forest, Forest Cover, ELC and SLC | Mixed |
| 2013-06-11 | Sub-decree 353 | 433 ha | Wildlife Sanctuary, Protected Forest, Forest Cover, ELCs | Mixed |
| 2013-06-16 | Sub-decree 393 | 3,521 ha | Mondulkiri Genetic Resources Protected Forest (3,491.31 ha), Mondulkiri Protected Forest (4.22 ha), DTC Group ELC (25.48 ha), at Mepai village, Pu Chey commune | 3,134.46 ha to 750 families in 1,335 private parcels; 386.55 ha reserved as state public |
| 2013-06-16 | Sub-decree 395 | 753 ha | Conservation Forest, Protected Forest, ELC | Not stated in the record |
| 2014-01-13 | Sub-decree 17 | 1,286 ha | Forest Cover, Conservation Forest, ELC | Economic land concession |
| 2014-03-19 | Sub-decree 142 | 1,698 ha | Wildlife Sanctuary, Forest Cover, ELCs | Economic land concession |
| 2017-01-05 | Sub-decree 04 | — | Zoning of Lomphat Wildlife Sanctuary (with Ratanakiri) | State |
| 2017-01-05 | Sub-decree 05 | — | Zoning of Phnom Prich Wildlife Sanctuary | State |
| 2018-01-22 | Prakas 061 | — | Establishes Ping Prong Klong Pesh Tho community forest, Poule village, Dak Dam commune | Community forest |
| 2021-10-04 | Sub-decree 194 | 358 ha | Chrey Sen village, Meaknourum commune and O'Spean village, Spean Mean Chey commune | Sen Monorom City |
| 2022-03-23 | Sub-decree 59 | — | State public to state private, Sangkat Romnea and Sen Monorom | State private |
| 2022-03-29 | Sub-decree 66 | — | State public to state private, Sen Monorom commune, Ou Reang | State private |
| 2023-06-05 | Sub-decree 117 | — | Orders implementation of Mondulkiri's land management plan | State |
| 2026-05-19 | Sub-decree 93 | 32 ha | Sustainable use zoning, Phnom Prich and Keo Seima Wildlife Sanctuaries | Concessions within the sustainable use zone |
Instruments that establish protection rather than remove it — Sub-decree 75 (2002, Mondulkiri Protected Forest) and Sub-decree 143 (2009, Keo Seima) — carry no hectare figure in the catalogue and are shown for context. Note Sub-decree 206 of 2007: it downsizes the protected forest created by Sub-decree 75 five years earlier.
The zoning, dated at last — and one figure confirmed exactly
Verified Source: Management zones of natural protected areas (2019–2026), Open Development Cambodia, digitised from Royal Gazette sub-decrees by ODC’s mapping team using QGIS. 63 rows nationally, updated 2026-07-24. Licensed CC BY 4.0 — attribution only, not share-alike, unlike ODC’s legal records above.
This Atlas already draws sanctuary zoning from the provincial GIS. What it never had was the date each zoning was issued. Mondulkiri’s three zoned sanctuaries: Lomphat, 5 January 2017 (Sub-decree 04); Srepok, 7 February 2019; Phnom Prich, 15 February 2019.
And one figure now stands confirmed from two independent chains. Phnom Prich’s conservation zone is 78,850 ha in ODC’s table, digitised from the national gazette — and 78,850 ha in Table 5 of the Provincial Spatial Plan, compiled separately by the provincial planning committee. Nothing else in this Atlas is corroborated that precisely.
Lomphat Wildlife Sanctuary, all fourteen zones
Lomphat is the only one of the three ODC sizes completely. This is the whole sanctuary across Ratanakiri and Mondulkiri, not the Mondulkiri share — the Spatial Plan’s 49,210 ha figure counts only the part inside this province. Srepok’s sixteen zones and twelve of Phnom Prich’s thirteen carry no area in the source at all.
| Zone | Area | Share |
|---|---|---|
| Conservation zone | 105,285 ha | 42.1% |
| Sustainable use zone | 79,125 ha | 31.7% |
| Core zone | 41,920 ha | 16.8% |
| Community zone | 23,669 ha | 9.5% |
| Total | 249,999 ha | 100% |
The total, 249,999 ha, is a third figure for Lomphat: this Atlas carries 248,014 ha from GIS layer 44 and 254,152 ha from summing the GIS zoning polygons. All three sit within 1.6% of each other, which for a boundary shared with another province is close agreement rather than a dispute.
Keo Seima is missing here too
This Atlas has recorded that the provincial GIS holds no zoning for Keo Seima. ODC’s national compilation — Lumphat, Srepok, Phnom Prich, Cardamom Mountains, Toul Pon Taley Boeung Snae, Phnom Krang Dei Meas, Phnom Kulen and Siem Pang — does not contain it either. Nor Phnom Namlear. So the gap is not a provincial filing failure: Mondulkiri’s second-largest protected area, the one with the most people living inside it, has no published management zoning in either source. That is a stronger and more troubling statement than the one this Atlas was making, and it is the reason the gap stays open rather than being quietly downgraded.
Licence. Open Development Cambodia does not use one licence for everything, and it matters. Its legal records — the sub-decree chronology above — carry CC BY-SA 4.0, which is share-alike: anything built from them must carry the same terms, so this panel is offered under CC BY-SA 4.0 and anyone reusing it inherits that obligation. Its zoning dataset, used in the section immediately above, carries CC BY 4.0 — attribution only, no share-alike. Applying the stricter licence to both by reflex would have been easier and wrong. The underlying sub-decrees are Royal Gazette instruments of the Royal Government of Cambodia.
The Spatial Plan, 2020–2040
Everything above this point is a snapshot: boundaries and attributes as they stood when somebody digitised them. The Provincial Spatial Plan is the other half of the picture. It measures the same province across twenty years, projects it twenty years forward under five different futures, and states what the administration intends to do about it. Adopted 2021, 164 pages, prepared for the Provincial Committee for Land Management and Urban Planning. Page numbers are given throughout so any figure here can be checked against the document.
A fifth of the province changed cover in twenty years
Between 1999 and 2019, 303,464 ha changed land cover — 21% of Mondulkiri. Two processes account for almost four fifths of it, and they run in opposite directions.
Five futures for 2040
The Plan does not forecast one population; it models five, and the difference between them is migration policy. That is the honest way to do it here, because in-migration is what drives growth in this province — net migration rates run from 2.2% to 23.3% by district against a national mean of 0.86% (p65).
| Scenario | Population 2040 | Multiplier | More people | More households |
|---|---|---|---|---|
| S1 Strong control over migration | 145,589 | ×1.64 | +56,940 | +13,557 |
| S2 Moderate control over migration | 153,030 | ×1.73 | +64,381 | +15,329 |
| S3 Unchanged trajectory | 160,868 | ×1.81 | +72,219 | +17,195 |
| S4 Pro-migration policy, moderate in-migration | 171,878 | ×1.94 | +83,229 | +19,816 |
| S5 Pro-migration policy, strong in-migration | 190,208 | ×2.15 | +101,559 | +24,181 |
Verified · The Plan then converts households into land: between 28,470 and 96,723 ha of new agricultural land will be needed by 2040, depending on how many households farm and how much each is allocated (Table 13, p100). The upper figure is larger than every economic land concession in the province combined.
Population and growth, district by district
| District | 2009 | 2019 | Growth / yr | People / km² |
|---|---|---|---|---|
| Kaev Seima | 16,886 | 26,248 | 4.41% | 9.0 |
| Kaoh Nheaek | 16,239 | 22,718 | 3.36% | 4.0 |
| Pechreada | 10,892 | 21,255 | 6.69% | 5.3 |
| Saen Meaknourum | 9,572 | 14,252 | 3.98% | 26.4 |
| Ou Reang | 4,077 | 6,476 | 4.63% | 5.3 |
| Province | 57,666 | 90,949 | 4.56% | 6.3 |
Verified · The province grew at 4.56% a year against a national 1.2%. Pechreada nearly doubled. Meanwhile household size fell from 4.5 to 4.2 people, so the number of households grew faster still — which is what actually drives demand for land.
What each district farms
| Land use | Kaev Seima | Kaoh Nheaek | Ou Reang | Pechreada | Saen Meaknourum | Total |
|---|---|---|---|---|---|---|
| Cropland (annual or perennial) | 34,316 | 8,939 | 6,858 | 26,029 | 3,470 | 79,612 |
| Mosaic forest–cropland | 2,553 | 2,025 | 8,935 | 8,750 | 7,396 | 29,659 |
| Paddy rice | 5,158 | 15,901 | 13 | 1,531 | 174 | 22,776 |
| Rubber plantation | 14,348 | 25,053 | 3 | 28,441 | 480 | 68,325 |
| Pepper plantation | 59 | 0 | 136 | 492 | 162 | 848 |
| Perennial crop (unspecified) | 0 | 16 | 98 | 11 | 139 | 264 |
| Total agriculture | 56,434 | 51,933 | 16,042 | 65,255 | 11,820 | 201,484 |
Verified · The districts farm differently. Kaoh Nheaek grows 70% of the province's paddy rice and holds the most rubber. Ou Reang and Saen Meaknourum are dominated by forest-crop mosaic — shifting cultivation and smallholdings rather than plantations. Pechreada carries 42% of all rubber.
Where the Plan and the GIS disagree
Having two official sources is more useful than having one, because the places they diverge are exactly the places a single figure would have misled you. All four gaps below are real, and none of them means one source is simply wrong — they were measured at different times, by different methods, for different purposes.
| Figure | Spatial Plan | The GIS | Gap |
|---|---|---|---|
| Provincial area | Spatial Plan, Ministry of Interior figure 1,428,800 ha | GIS district polygons, measured 1,372,090 ha | 56,710 |
| Population | Spatial Plan, Commune Database 2019 90,949 people | Information Book, 2019 census 92,213 people | 1,264 |
| Mining licence area | Spatial Plan survey, January 2021 213,531 ha | GIS layer 41 polygons 163,586 ha | 49,945 |
| Villages | Spatial Plan administrative table 92 villages | GIS village-centre layer 77 villages | 15 |
Contested · The mining gap is the one to watch: 49,945 ha, because the Plan counts licences surveyed in January 2021 while the GIS holds polygons from September 2017 and only those still valid. The area gap is definitional — 1,428,800 ha is the Ministry of Interior's administrative figure, while the GIS measures the boundary as drawn. This Atlas quotes both and says which is which; these checks also run live in The Atlas checks itself.
Roads, climate and work
The road network tripled in two years
Total road length went from 672,793 m in 2017 to 1,029,431 m in 2019. The strategic network is 211.7 km of national road — NR76 (185.32 km) running southwest to north, and NR76.4 (26.45 km) to the Dak Dam border crossing — plus 10 provincial roads totalling 410.41 km and 84 rural roads totalling 623.48 km.
Table 8 and §2.6.1, p60
Cooler and wetter than the rest of Cambodia
One station, at Saen Meaknourum. Average annual rainfall 2,001 mm over 2015–2018, ranging 1,648–2,266 mm between years. Mean temperature 27.2°C, from 16.2°C in January to 37.0°C in April. Elevation runs 40–1,030 m — note that figure, because a national contour layer would tell you 1,760 m.
§2.3.1–2.3.2, p25
Almost everyone farms
82% of adults give agriculture as their primary occupation and 15% services. As a secondary occupation, 68% farm and 25% collect forest products or fish — which is the number that matters when the forest is described as an economic asset. It is not a metaphor here; it is a quarter of the province's second income.
§2.7.4, p67
Two futures, and what the province chose
The figures in the previous panel are the Plan's measurements. This one is its argument. It models two ways the next decade could go, finds that by Cambodia's own definition this province contains no towns at all, values six things the forest does for the economy, and commits to five goals. Everything here is read from the document, with pages given.
Ninety-two percent, or thirty-four
Working from a 2010 baseline of 92% forest cover, the Plan carries through two scenarios to 2030. The gap between them is the whole argument of the document.
Conservation — 85% forest by 2030
Development — economic land concessions and mining — is confined to land outside the wildlife sanctuaries and the biodiversity corridor. Ecosystem-service hotspots survive outside the already-developed belt south of Sen Monorom. Financial incentives are assumed for conserving resources inside or beside development areas.
The trade-off: Hard to sustain against illegal logging, clearance and snaring unless communities hold a stake — which means viable community protected areas and workable agriculture in the community zones, not just enforcement.
34% forest by 2030
The current trajectory continues: weak enforcement, high deforestation, roads pushed into the sanctuaries with linear sprawl behind them, a new airport in Ou Reang, agro-industrial and bauxite expansion in the south-east, cross-border processing and trade.
The trade-off: Quick and sizeable profits in the short run, which is exactly what makes it hard to prevent. Ecosystem services fall to a low level everywhere, including inside protected areas.
A province with no towns in it
Cambodia declares a commune urban on three tests: population above 2,000, density above 200/km², and agriculture below half the labour force. By Cambodia's national definition, Mondulkiri has no urban areas at all. Sangkat Monourom meets the density test at 214 people/km² and clears the employment test with 13% in agriculture — and then fails on population, with 1,945 people. Not one commune or sangkat in the province passes all three.
So the Plan classifies centres by what they can actually do for you: 28 services — social, cultural, economic — each scoring one point.
| Tier | Score | Centres |
|---|---|---|
| High | 25–28 points | Krong Saen Meaknourum |
| Medium | 17–24 points | Srae Khtum (Kaev Seima), Srae Sangkum (Kaoh Nheaek) |
| Low | 9–16 points | Memang (Kaev Seima), Srae Preah (Kaev Seima), Saen Meaknourum (Ou Reang), Pu Chrey (Pechreada), Bou Sra (Pechreada) |
Verified · Even the highest-ranked centre has neither a private hospital nor a university. This is the practical meaning of a population of 92,000 spread across 14,288 km²: the settlement hierarchy exists, but it is built out of health centres and secondary schools rather than anything a census would call a town.
Six things the forest does
Mapped with InVEST (Integrated Valuation of Ecosystem Services and Tradeoffs) on a 2010 baseline, each scored 0 to 1 across the province.
- Carbon storage (regulating) — How much carbon the vegetation holds.
- Non-timber forest products (provisioning) — Resin, honey, bamboo, rattan, wild food — a quarter of the province's adults collect these as a second occupation.
- Habitat quality (supporting) — How intact the habitat is for the species that need it.
- Water retention (regulating) — How much water the landscape holds rather than sheds.
- Nutrient retention (regulating) — Nutrients kept out of the watercourses.
- Sediment retention (regulating) — Soil held in place rather than washed downstream.
The combined index tracks carbon storage and non-timber forest products most closely — which is to say the two services people can most directly eat or sell are also the ones the map is most sensitive to.
| Where | Under what pressure | |
|---|---|---|
| A | Phnom Namlear and its surroundings | High service provision, threatened by concession-driven landscape homogenisation, clearance for agriculture and bauxite mining. |
| B | South-west Kaev Seima | Already heavily deforested, by smallholders and concessions both. Protection inside Keo Seima Wildlife Sanctuary is what holds the remaining services. |
| C | North-west corner of the province | A hotspot threatened by the same homogenisation, driven by expanding rubber. |
| D | Along the Srepok corridor | Retained services depend on the sanctuary network staying intact. |
Five goals to 2040
The vision the Plan sets out rests on four commitments: Forest conservation as Cambodia's contribution to climate change mitigation; Ecotourism that respects the environment and the province's ethnic diversity; Agriculture where agro-industry and smallholders co-evolve through agro-ecological intensification; An active north-east pole linking Cambodia into the CLV triangle. Those become five long-term development goals and 14 objectives, each tied to somewhere specific on the map (p106).
LTDG 1 · Sustainable biodiversity conservation and livelihoods inside the protected-area system
- Enhance conservation in wildlife sanctuaries and the biodiversity corridor
- Limit the harm from large-scale state-sponsored projects
- Support education centres for biodiversity learning and research
LTDG 2 · Ecotourism tied to community-based natural resource management
- Strengthen ecotourism linked to resource management and cultural preservation
- Support vocational training in tourism products and services
LTDG 3 · Sustainable agriculture for smallholders, and community resource management outside protected areas
- Develop a viable family-farming sector
- Make large-scale agro-industry responsible
- Reinforce community forestry and fisheries co-management
LTDG 4 · A stronger role in national development and CLV regional integration
- Transport and mobility that also serve the local population
- Planned growth of cross-border areas as new centres
- Agriculture-based industry linked to transport and dry ports
LTDG 5 · Sustainable, inclusive, service-oriented urbanisation at several levels
- Planned urban development for growing service needs
- Greener urban landscapes and urban agriculture
- Efficient urban management: water, wastewater, solid waste
How much of the Plan is here
164 pages and 46 map sheets. This is what has been taken and what has not — kept current, because a claim of completeness is exactly the kind of thing the rest of this site exists to check.
| State | Sections | Note |
|---|---|---|
| Published | 2.2 boundaries · 2.3.1–4 topography, climate, water, soils · 2.4.1–3 land cover, land use, forestry zonation · 2.4.4–5 agriculture and mining · 2.6.1 roads · 2.7.1–4 population, migration, ethnicity, social services, employment · 2.8.2–4 land use systems, urban centres, economic poles · 2.5 ecosystem services · 3.1.1–3 scenarios, projection, climate vulnerability · 3.2 vision · 3.3 the five goals | Every figure carries its page number. This is all of chapters 2 and 3 that holds data or decisions. |
| Summarised | Chapter 4, the fourteen spatial development strategies | Held as the five goals and their fourteen objectives. The sub-strategy text is prose; the goals carry its substance. |
| Not taken | 2.1 history · 2.4.6 tenure security · 2.6.2 the road law · 2.8.1 regional connectivity · chapter 5 activity plan · chapter 6 monitoring · chapter 7 conclusion · the annexes | Procedural or institutional rather than substantive: committee membership, meeting records, monitoring templates. The road law is legal text already covered by the Legal Register. |
| Maps | 17 of the Plan's 46 sheets, extracted at native resolution | The seventeen that show something the GIS cannot: the InVEST ecosystem-service surfaces, soil suitability, catchments, net migration, the two 2030 scenarios, and the intended urban hierarchy. See The Plan's own maps. The other 29 duplicate features this Atlas already draws from geometry. |
Derived · All of the Plan's substantive data is now on this site. What remains uncopied is procedural text: committee membership, meeting records and monitoring templates.
Water, soil, people, risk
The rest of the Spatial Plan. Most of it fills in the physical picture — what the soil is, where the water goes, how the protected estate is actually divided. One part of it does something else: it shows a sentence this Atlas has been repeating quietly expiring.
“A Bunong province” is becoming untrue
In 2009 the Bunong were a majority of families in Mondulkiri. Ten years later they were not. This is the clearest single consequence of the in-migration the Plan measures elsewhere, and it happened inside one decade.
Verified · In-migration is almost entirely Khmer and Cham. The Plan is blunt about what that means: the influx puts pressure on indigenous groups already vulnerable to national forest and agricultural modernisation policy.
How the protected estate is actually divided
The Atlas has the zoning for Srepok and Lomphat from the GIS. The Plan has all four sanctuaries in one table — and the totals reframe what “protected” means here.
| Sanctuary | Core | Conservation | Sustainable use | Community | Total |
|---|---|---|---|---|---|
| Srepok | 187,631 | 75,631 | 65,717 | 43,992 | 372,971 |
| Kaev Seima | 64,384 | 84,392 | 58,733 | 26,146 | 233,654 |
| Phnom Prich | 45,480 | 78,850 | 91,395 | 6,775 | 222,500 |
| Lumphat | 19,096 | 24,680 | 1,341 | 4,093 | 49,210 |
| Total | 316,591 36.0% | 263,553 30.0% | 217,186 24.7% | 81,006 9.2% | 878,336 |
Verified · Two thirds of the protected estate — core plus conservation, 66% — is closed to settlement. Only 9.2% is community zone, the one category where people may unambiguously live and farm. And 16% of the province's population already lives inside a protected area, a share the Plan expects to keep rising. Co-management covers some of the gap: 21 community protected areas over 63,079 ha (6.7% of the protected estate, on 15-year agreements), plus 8 community forestry schemes over 9,799 ha involving 724 families.
What the ground is made of
| Soil | Share | What it means for farming |
|---|---|---|
| Acrisols | 64% | Clay-rich subsoil on sandstone, highly weathered and relatively poor. Low suitability for agriculture — except where waterlogged in lower ground, where they become well suited. |
| Leptosols | 11% | Very shallow over hard rock, or deep but extremely stony. On steep relief. Not suitable for agriculture. |
| Ferralsols | 9% | Red and yellow weathered soils of the south-eastern plateau, coloured by iron and aluminium oxides. Not chemically rich but deeply developed, and well suited to deep-rooting annual and perennial crops. |
| Gleysols | 6% | Wetland soils of the south-west, saturated long enough to develop gleyic colour. Moderately suitable if drained. |
Verified · Read this against the GIS soil-productivity layer, which found 61% of the province low-productivity: the two agree. Acrisols on 64% of the province are the reason. The good ground — ferralsols on the south-eastern plateau — is 9%, and it is the same corner that carries the roads, the concessions and the fastest-growing communes.
Where the water goes
Every main river here is a Mekong tributary, so the catchments run east to west and carry on into Kratie and Stung Treng. The Srepok is the significant one — part of the 3S system with the Sesan and Se Kong — rising in Vietnam's central highlands and crossing Kaoh Nheaek. Its level swings widely between seasons, and most other water bodies in the province simply dry up. Upstream dams on the Mekong and its tributaries are now measurably changing that fluctuation.
§2.3.3, p27
One operational district
Health services are organised by operational district rather than by administrative boundary. Mondulkiri has exactly one, covering the whole province. A health centre is designed to serve 5,000 people; a health post, 50,000. It holds 3 former district hospitals and 3 health centres. Set that against the Atlas's own finding that the median village is 27.7 km from a referral hospital.
§2.7.3, p66
Five land use systems
- Conservation area — Core and conservation zones. Effectively people-free, though residents may collect forest products for subsistence. One contiguous band from Kaev Seima in the south-west to Kaoh Nheaek in the north-east.
- Protected-area collaborative management — Sustainable-use and community zones. Twenty years of migrant-driven clearance have left a mosaic of forest, settlement and farmland.
- Economic land concession — Large-scale agro-industry, mostly rubber.
- High-intensity smallholder agriculture — Where farming is the primary land use.
- Low-intensity smallholder agriculture — Forest-crop mosaic and shifting cultivation.
§2.8.2, p74
The border economy
Mondulkiri shares 312 km of border with Vietnam — Dak Lak, Dak Nong and Binh Phuoc. The province exports timber, coffee, rubber, pepper and raw materials and imports agricultural products, vegetables, machinery, construction materials.
| Crossing | District | Status |
|---|---|---|
| La Pha Khe | Kaev Seima | major |
| Dak Dam | Ou Reang | major |
| Nam Lear | Pechreada | under development |
| Kaoh Romyearl (Ji Meat) | Kaoh Nheaek | unpaved road |
Verified · On tourism, the Plan records 114,349 visitors in 2017 — 102,590 Cambodian and 11,759 foreign, up 14% on 2013 — across 15 recognised attraction sites. Note the ratio: fewer than one visitor in ten is foreign, which is worth remembering against a Tourism Master Plan targeting 900,000 international arrivals by 2035.
What the climate is already doing
Climate change is felt here through drought, flood, fungal disease and insect infestation. Thuon and Sumaylo (2009) find high vulnerability to both flood and drought, on high exposure and high sensitivity. Both are increasing in frequency and duration, and both have already cut crop yield and quality in villages across the province, with consequences for food security. The general view in the province is that deforestation and land-use change are themselves driving the increase in intensity and frequency.
The Plan puts forward two responses:
- Agro-ecology — Conservation agriculture, home gardening, organic methods, the system of rice intensification, integrated pest management, agroforestry. Knowledge-intensive rather than input-intensive, and it values what farmers already know about their own ground. Makes farming more resilient to climate change while reducing its contribution to it.
- Forest conservation — Cambodia's contribution to mitigation, and the reason the conservation scenario matters beyond the province's own borders.
And one constraint that decides much of the rest. New settlement in the core and conservation zones is prohibited outright. With population rising under every scenario, that makes detailed land-use planning inside each sanctuary's community zone unavoidable rather than optional. The Plan argues for compact expansion around existing centres rather than linear sprawl along the roads — because sprawl is what pushes settlement into farmland and sanctuaries.
Verified · §3.1.3, p101. This is the point where the Plan's parts lock together: population rises under every scenario, the core and conservation zones are closed, only 9.2% of the protected estate is community zone, and 64% of the province is poor soil. The room to absorb 56,940–101,559 more people is not large, and it is not where most of them will want to go.
The Plan’s maps, made live
Derived Source: the seventeen map sheets of the Provincial Spatial Plan 2020–2040, extracted at native resolution. Placement is derived here by matching the province silhouette from the district geometry of GIS layer 2 against each sheet; overlap with the printed map is stated per sheet below the viewer.
The sheets below this one are pictures. These are not. Each has been located in longitude and latitude by matching the province’s own silhouette against the printed map, which means the Atlas’s vector layers can be laid straight over the top. Choose a sheet, fade it, add districts or mining licences or villages, and click anywhere to ask what is underneath. Two sheets can be wiped against each other — which is the only fair way to read the conservation scenario against business as usual, because it is the same frame both times.
Fifteen of the seventeen sheets are placed. Maps 7 and 9 are refused: both are wide regional sheets on which the province is a small part of the coloured area, and on both the fit landed somewhere plausible-looking and wrong. They stay in the gallery below as flat pictures, because a map that is out by a few hundred metres is worse than one that admits it has no coordinates. Map 10 and Map 23 print two panels side by side, and only the left panel is registered.
The map opens framed on the province, which puts each sheet’s printed legend outside the view. Legend zooms out to the whole sheet so you can read it; scroll to zoom and drag to pan at any time.
Boundaries are indicative only. The line shown between Mondulkiri and Viet Nam is drawn from a simplified provincial GIS layer and does not represent the international boundary. Delimitation and demarcation of that boundary are matters for the Royal Government of Cambodia and the Government of Viet Nam; only maps published under their authority are official.ព្រំដែនដែលបង្ហាញ ជាការប្រមាណប៉ុណ្ណោះ។ ខ្សែរវាងខេត្តមណ្ឌលគិរី និងប្រទេសវៀតណាម មិនមែនជាព្រំដែនអន្តរជាតិផ្លូវការទេ។ មានតែផែនទីដែលបោះពុម្ពដោយអាជ្ញាធររដ្ឋប៉ុណ្ណោះ ដែលមានលក្ខណៈផ្លូវការ។
The Plan's own maps
Every other map on this site is drawn from GIS geometry, which is better than copying a picture. These seventeen are the exception. They show surfaces that were modelled for the Spatial Plan and never released as data — the InVEST ecosystem services, soil suitability, catchment boundaries, net migration, and the two 2030 scenarios. For these, the printed sheet is the only version there is, so it has been lifted from the document at native resolution and is reproduced here with its map number and page.
Tap any sheet to open it full size. Khmer and English labelling is the source's own.
The two futures, mapped
The Plan's central comparison. Land use first, then the ecosystem-service surface that follows from it. Read 34 against 36, and 35 against 37 — the same province, ten years out, under two policies.
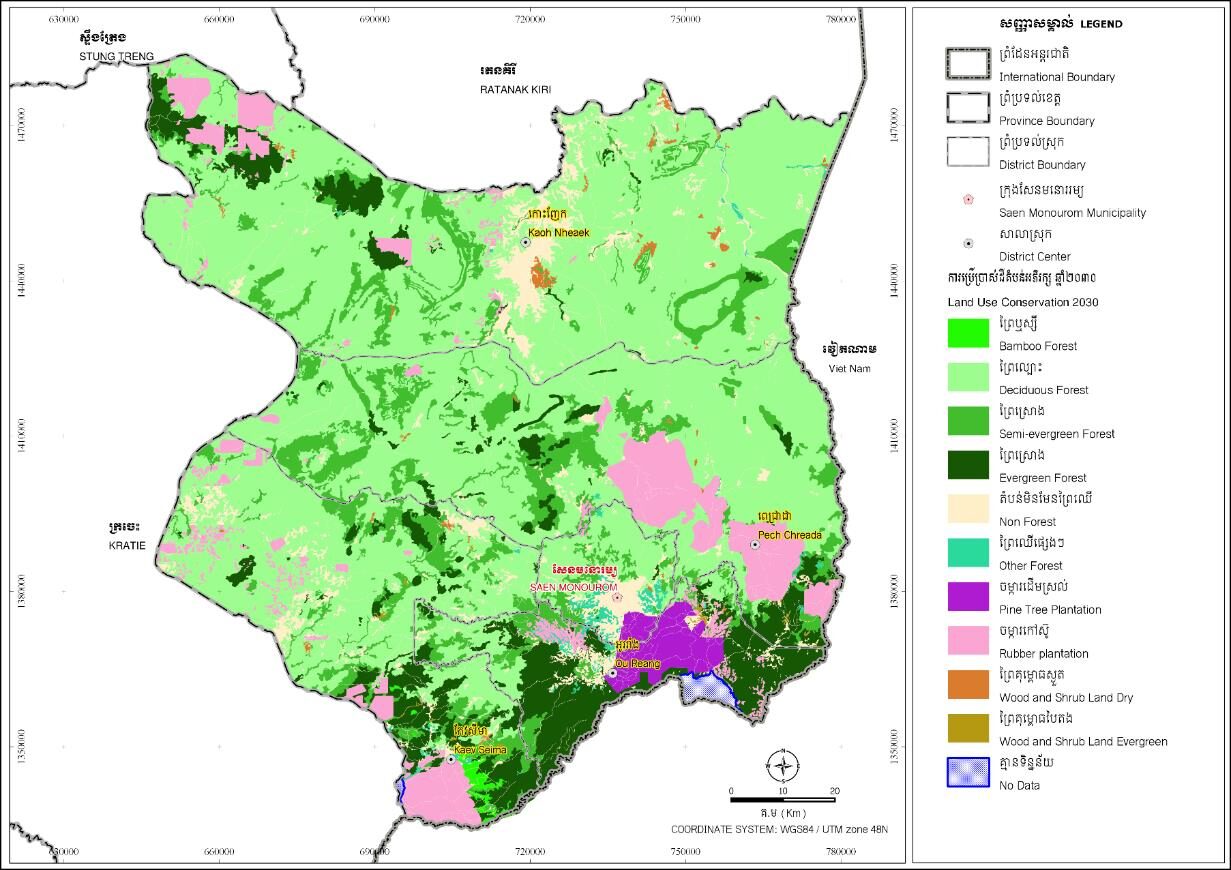
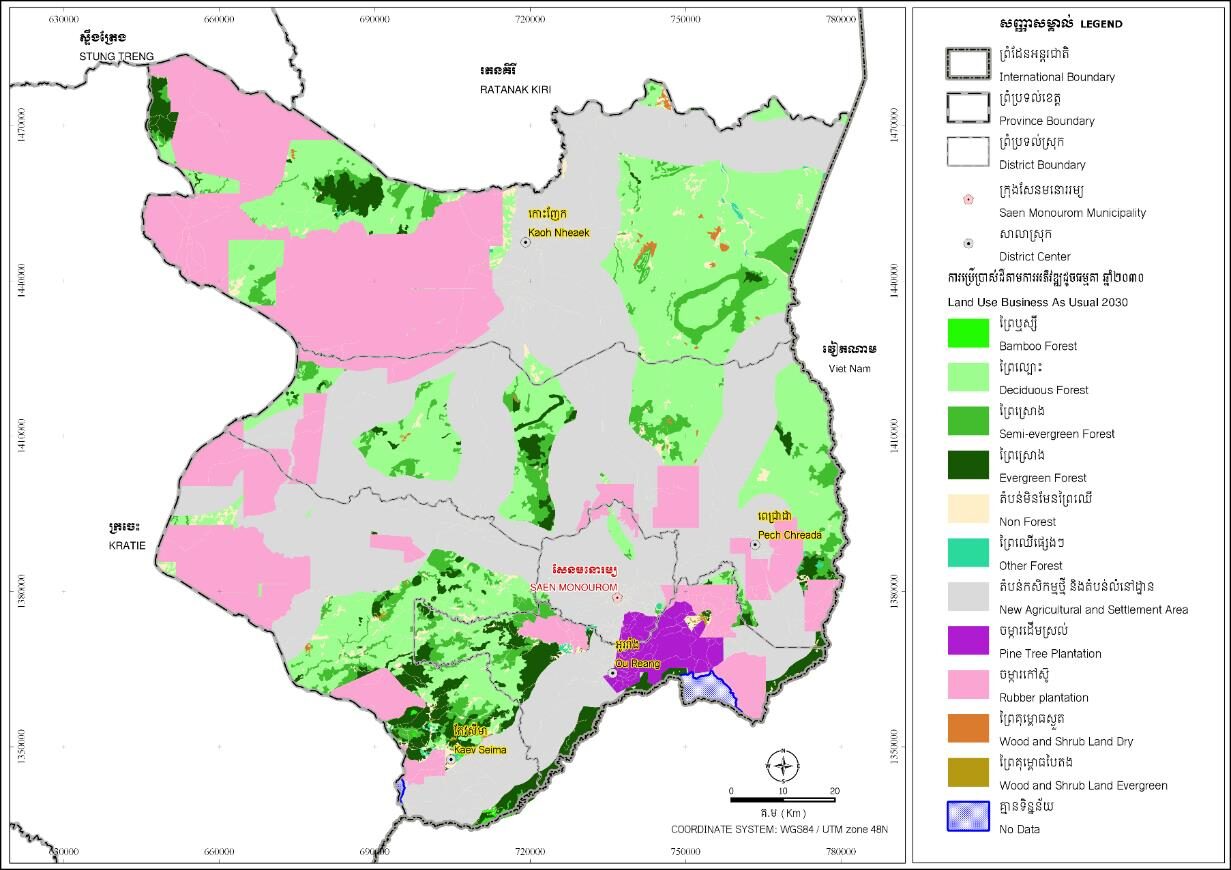
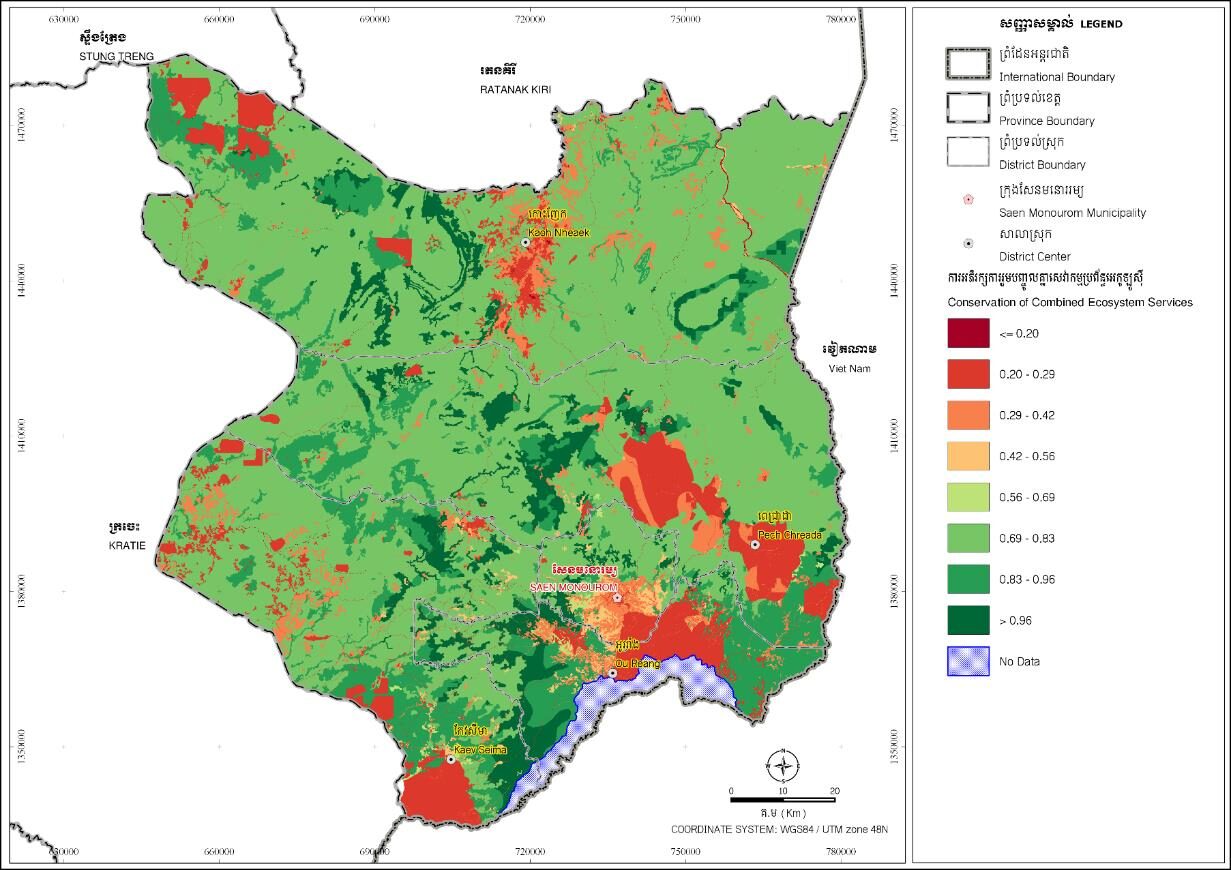
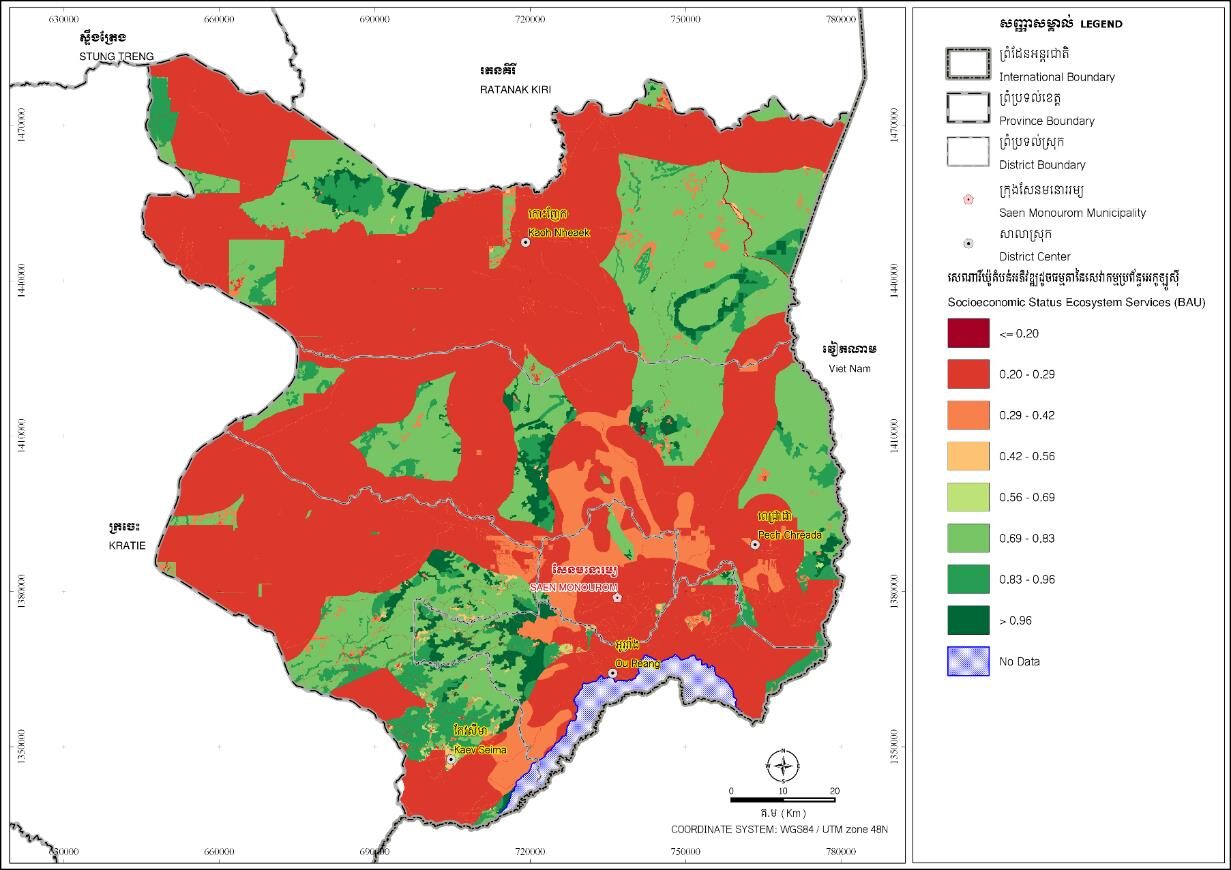
Surfaces that exist nowhere else
Six ecosystem services modelled with InVEST on a 2010 baseline, then combined. These were produced for the Plan and never published as geometry, so the sheet is the data. They are printed small in the source and cannot be enlarged beyond what you see.
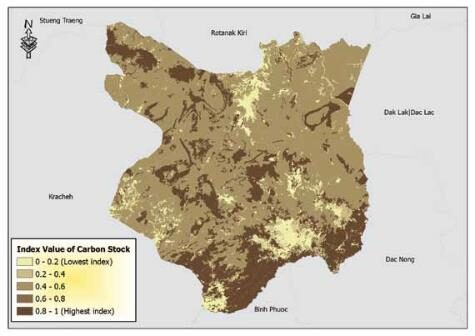
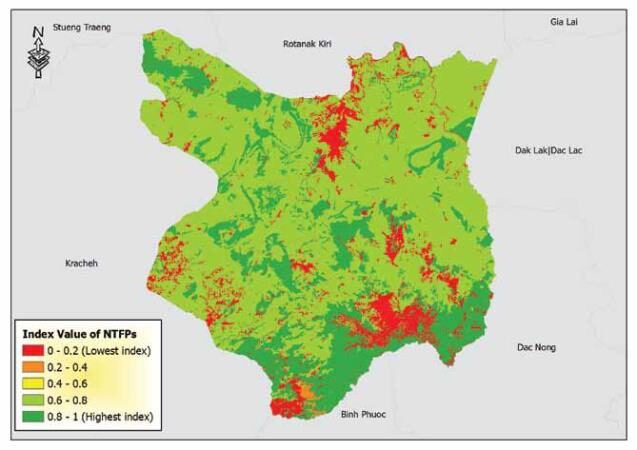
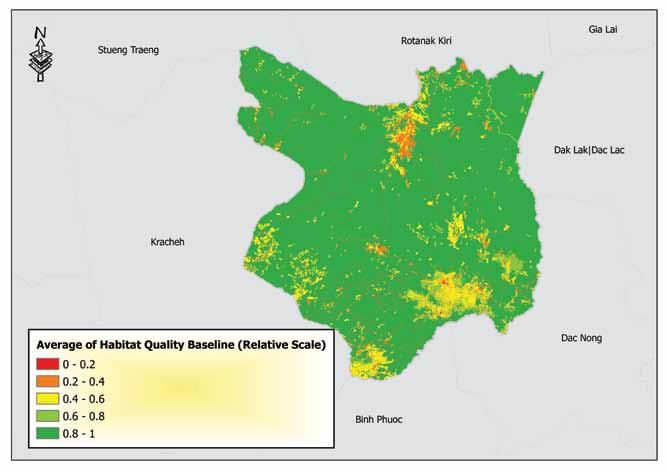
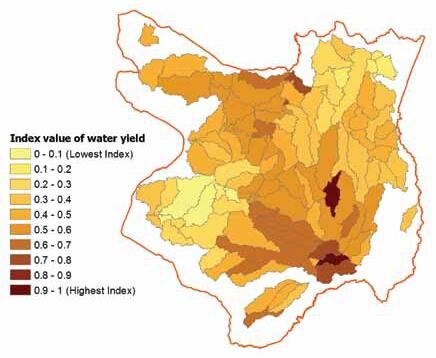
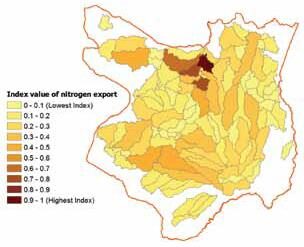
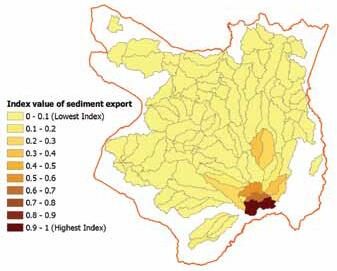
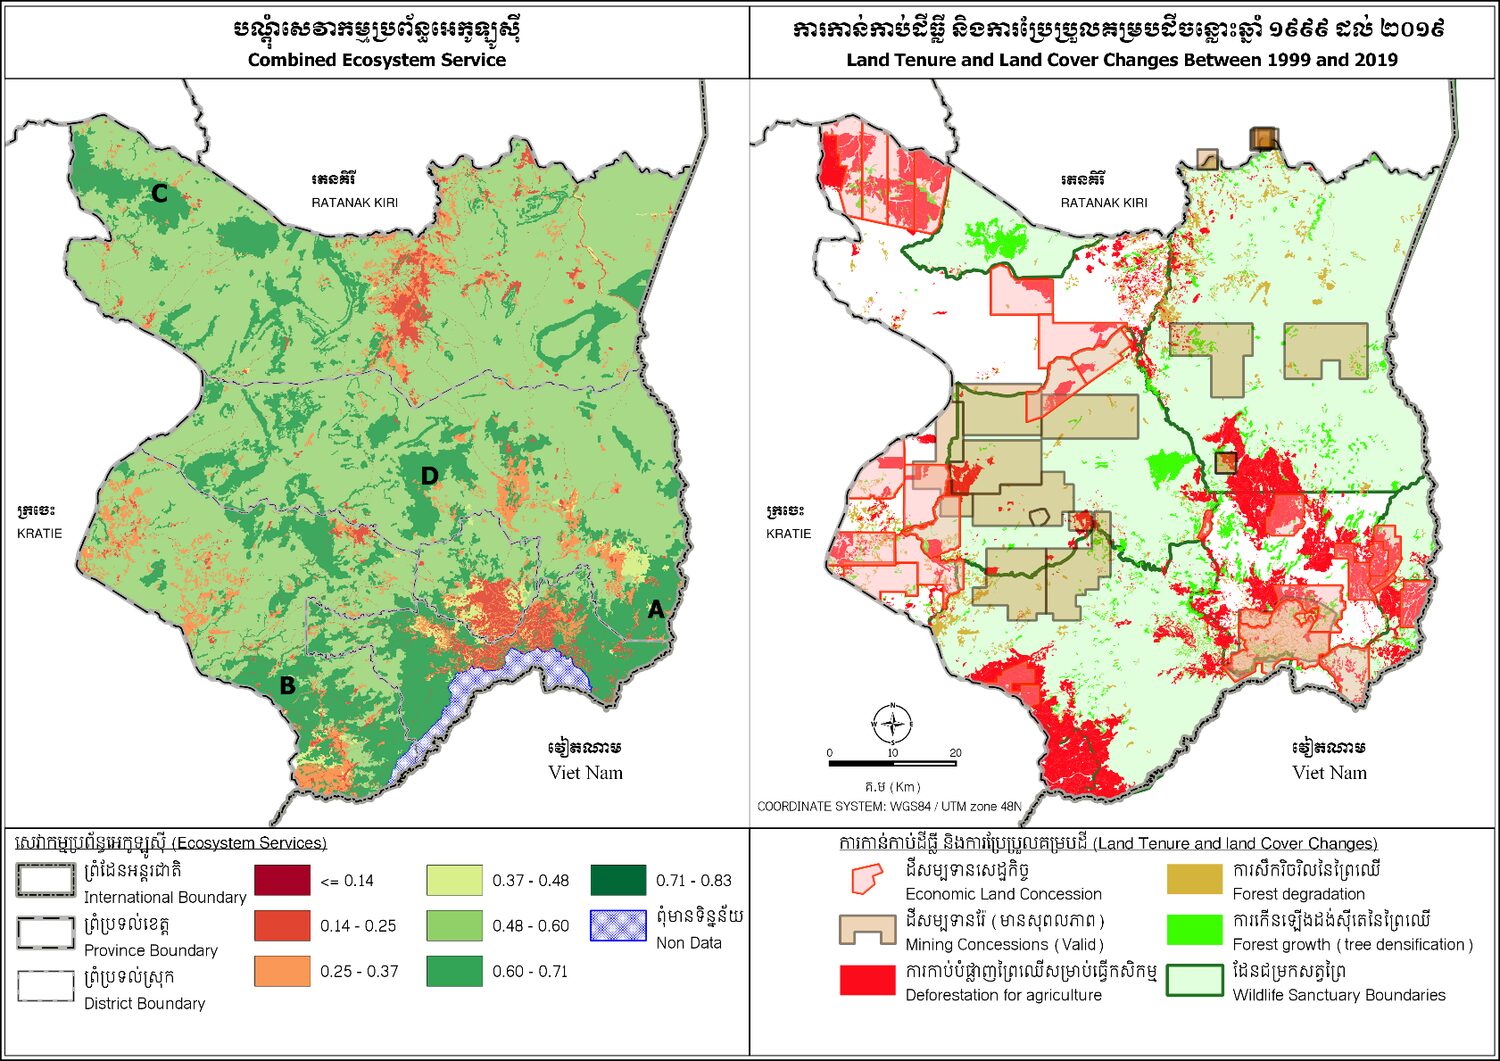
Physical ground
Catchments, soil suitability and the two-date land-cover comparison behind the 303,464 ha figure. None has a GIS equivalent the province publishes.
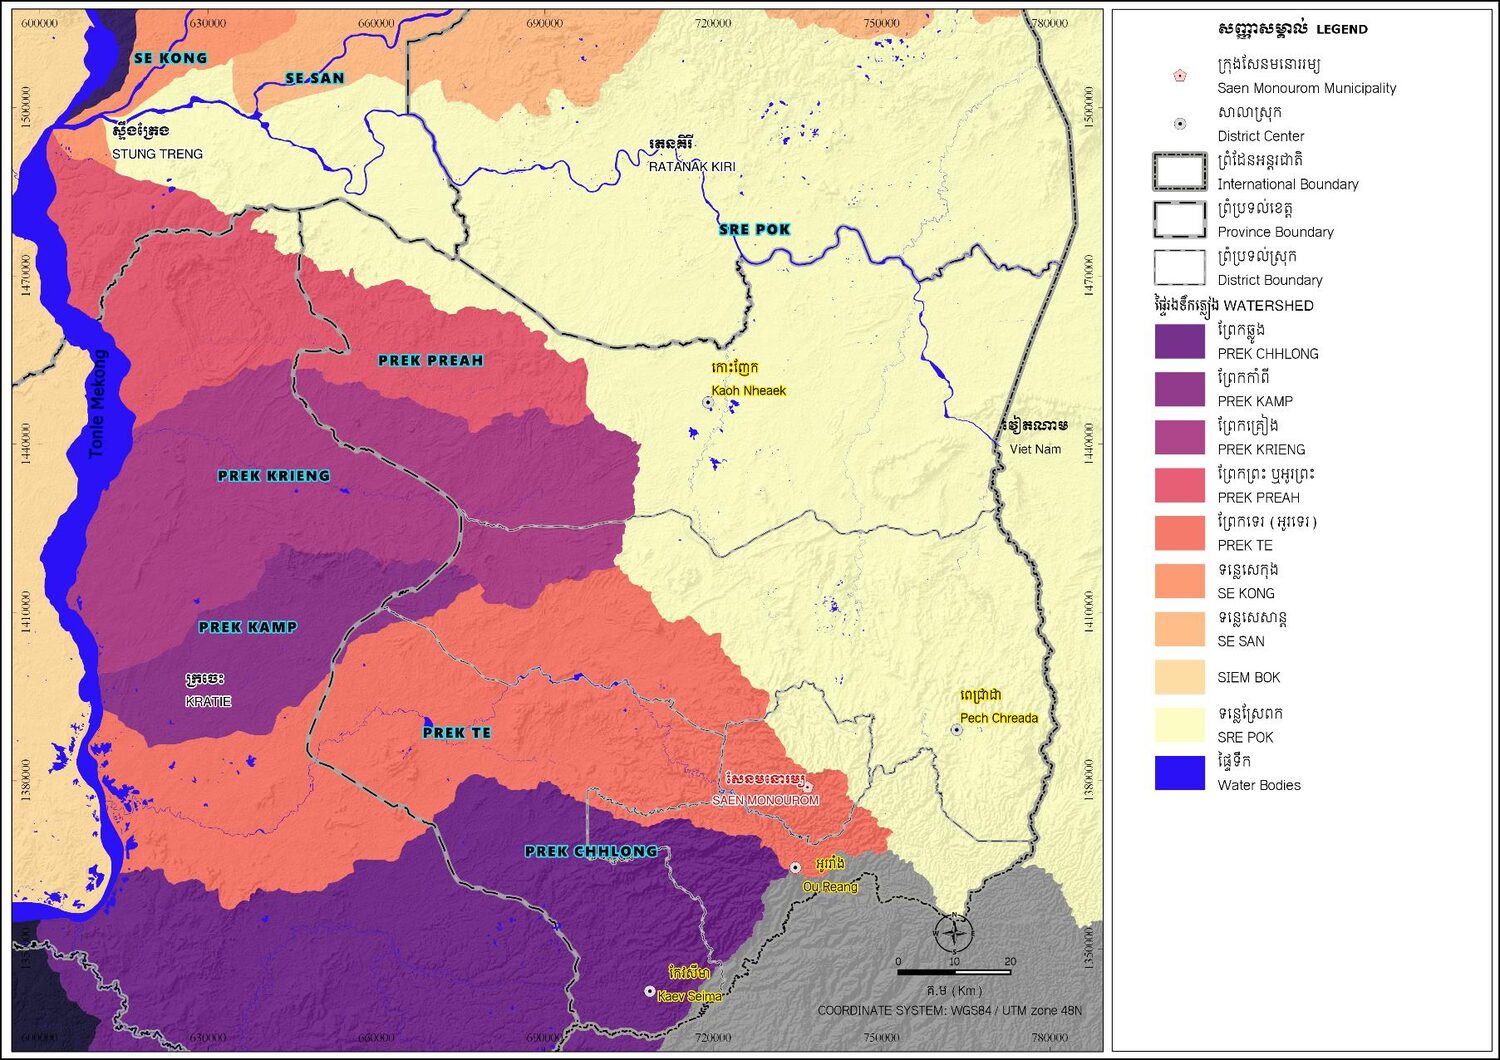
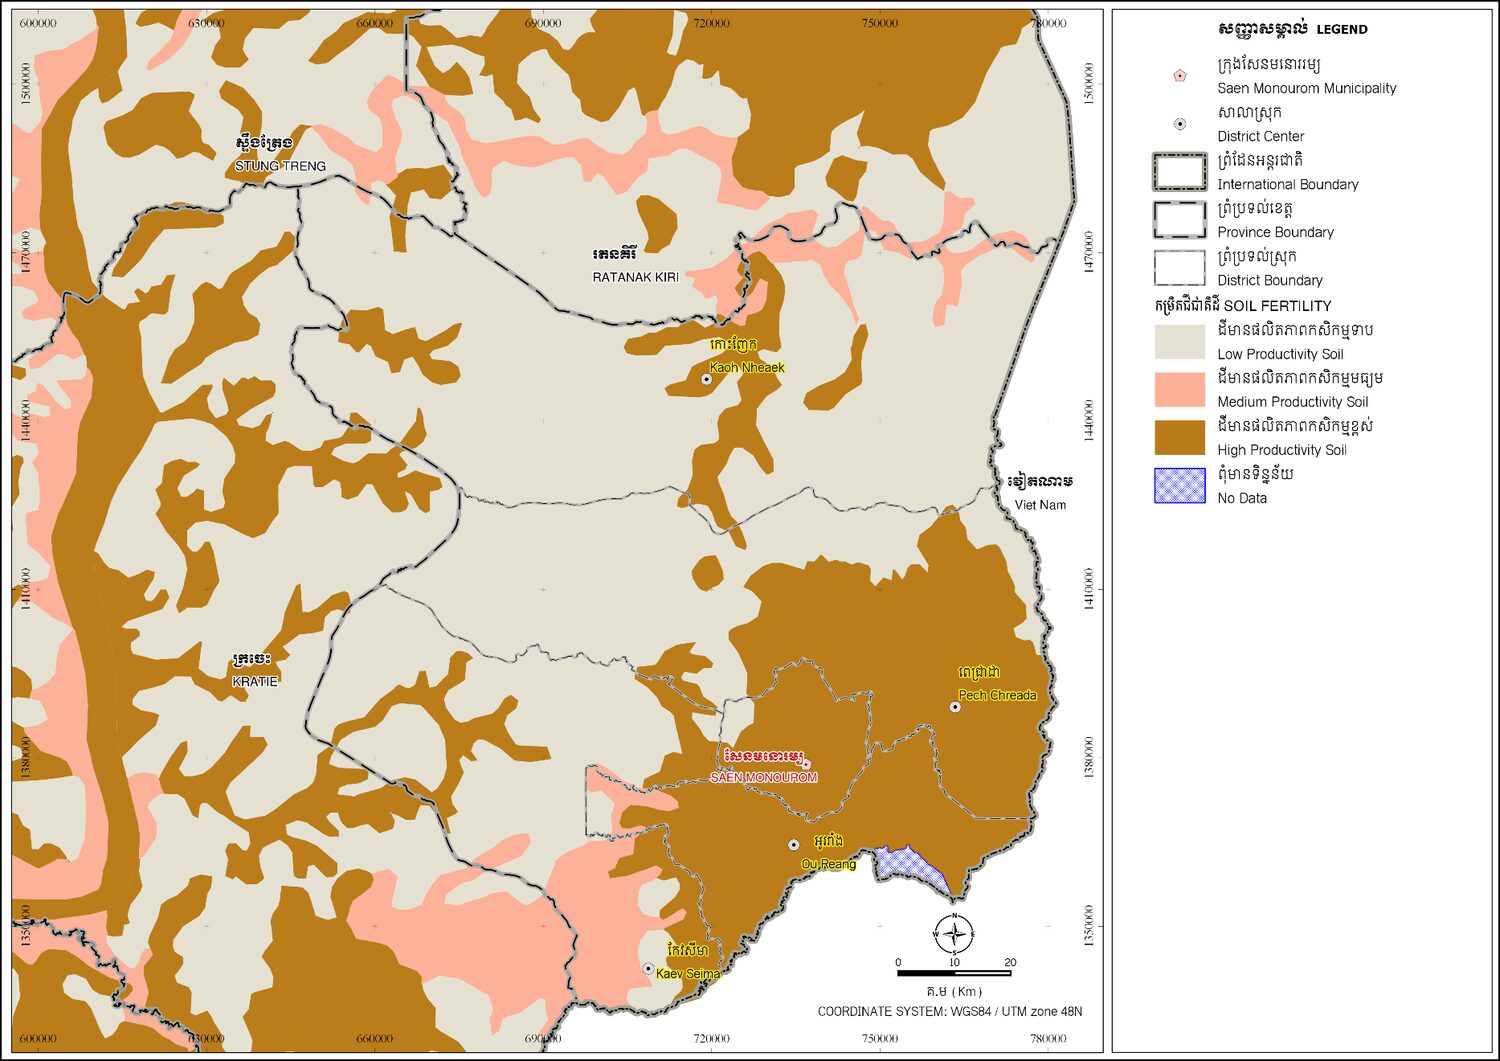
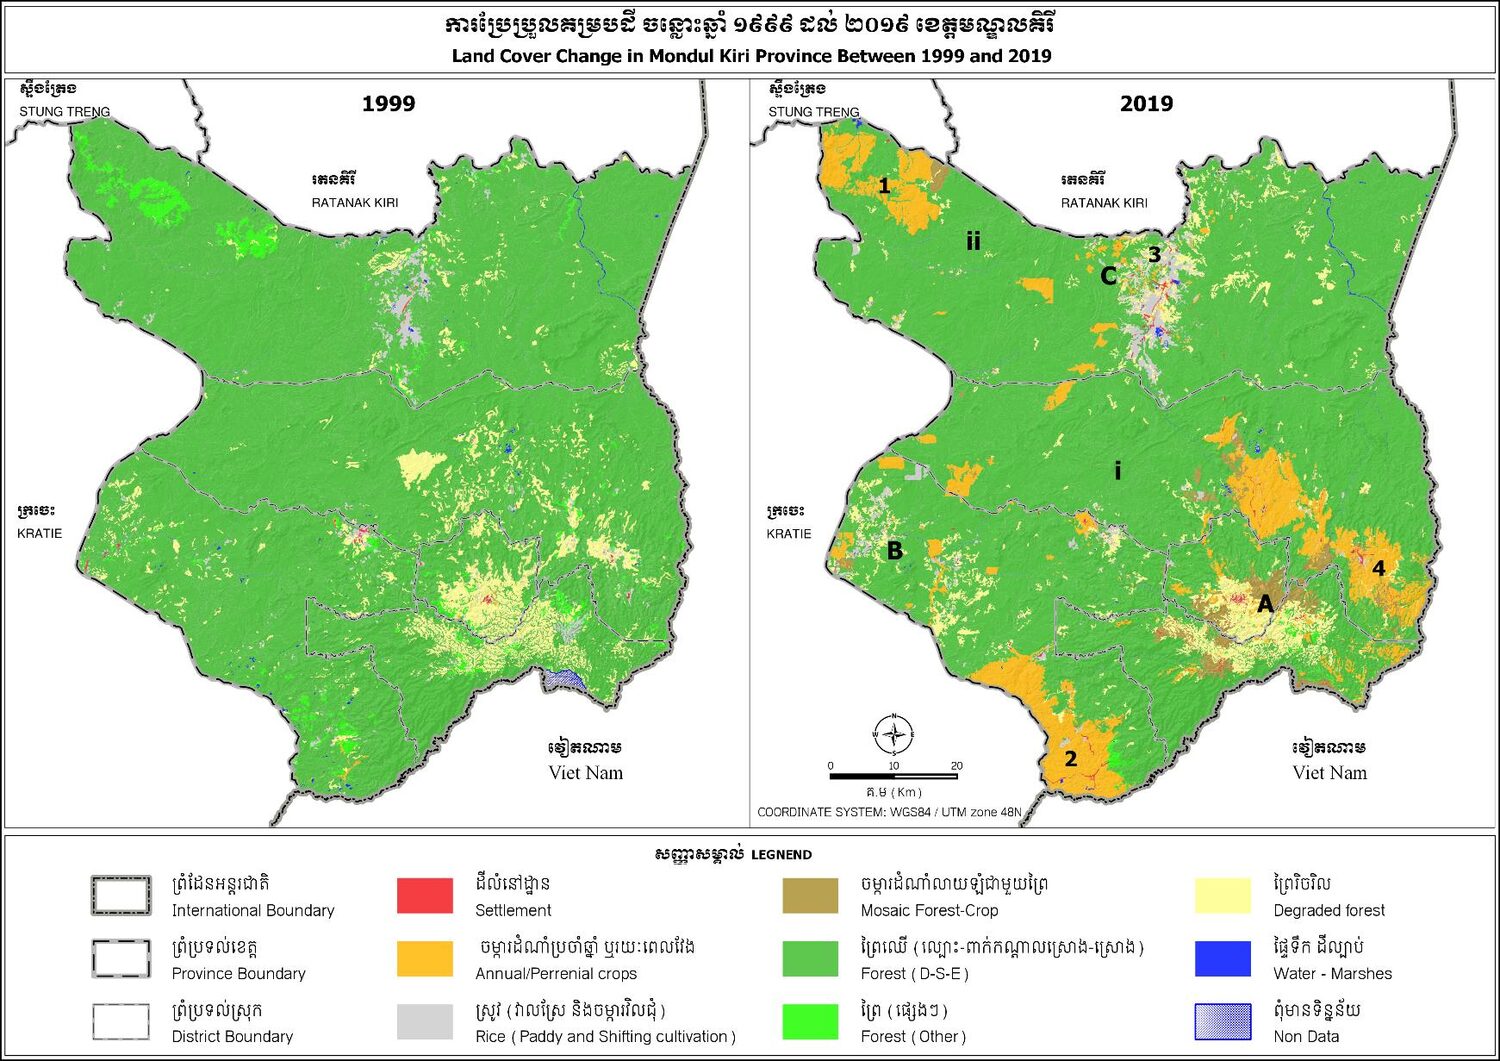
People and intent
Net migration from the 2008 census, the urban hierarchy the Plan intends by 2040, and every strategy on one sheet.
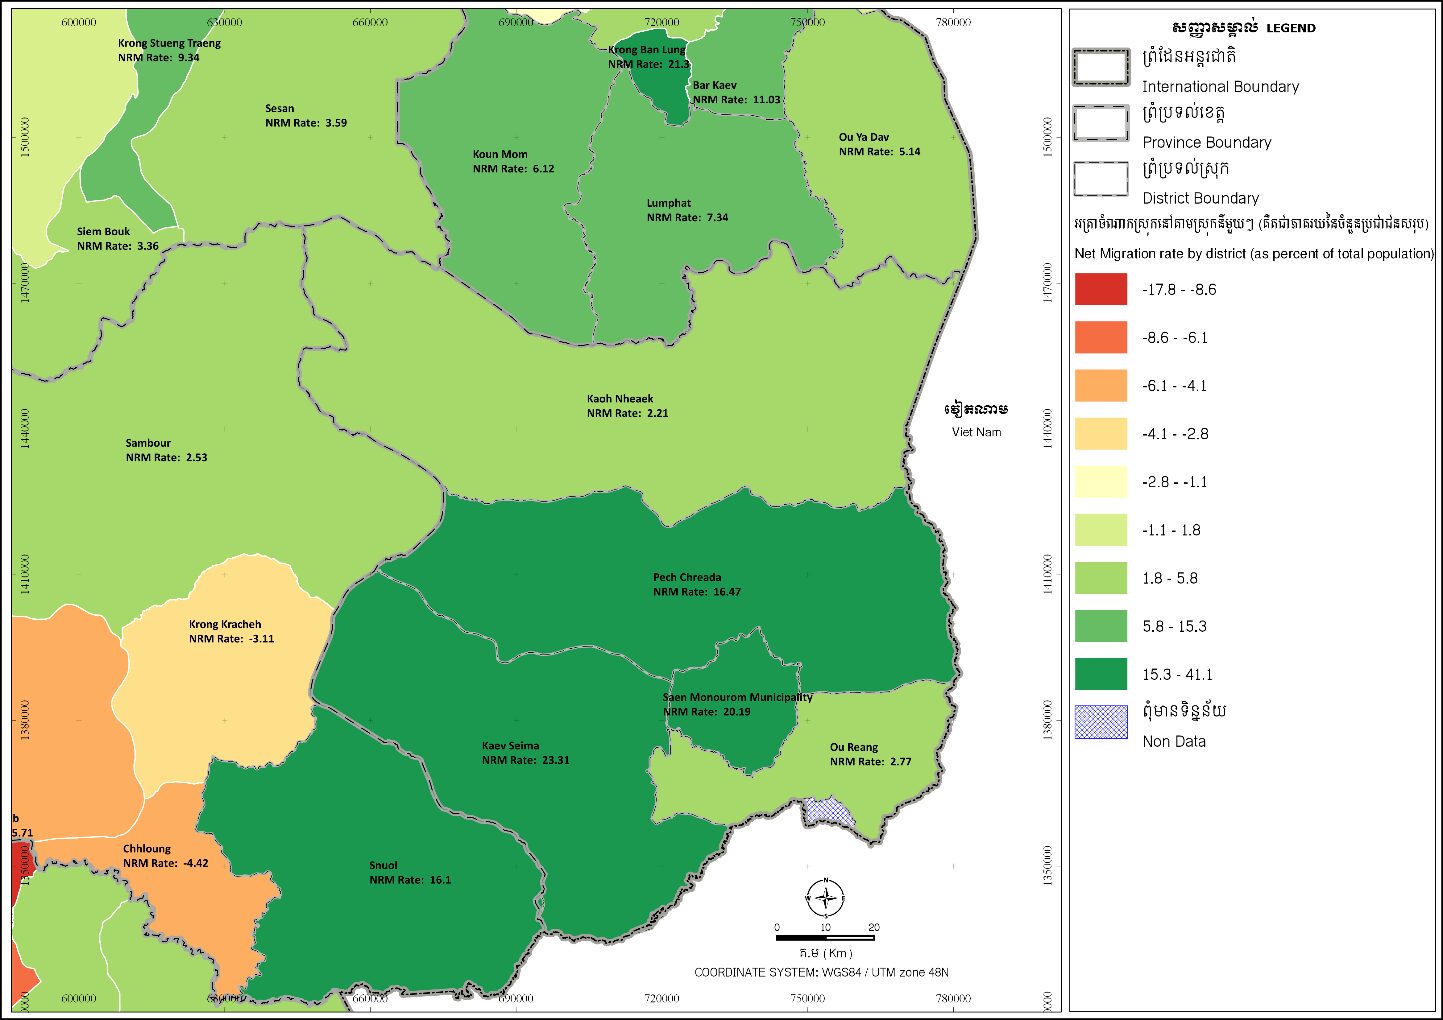
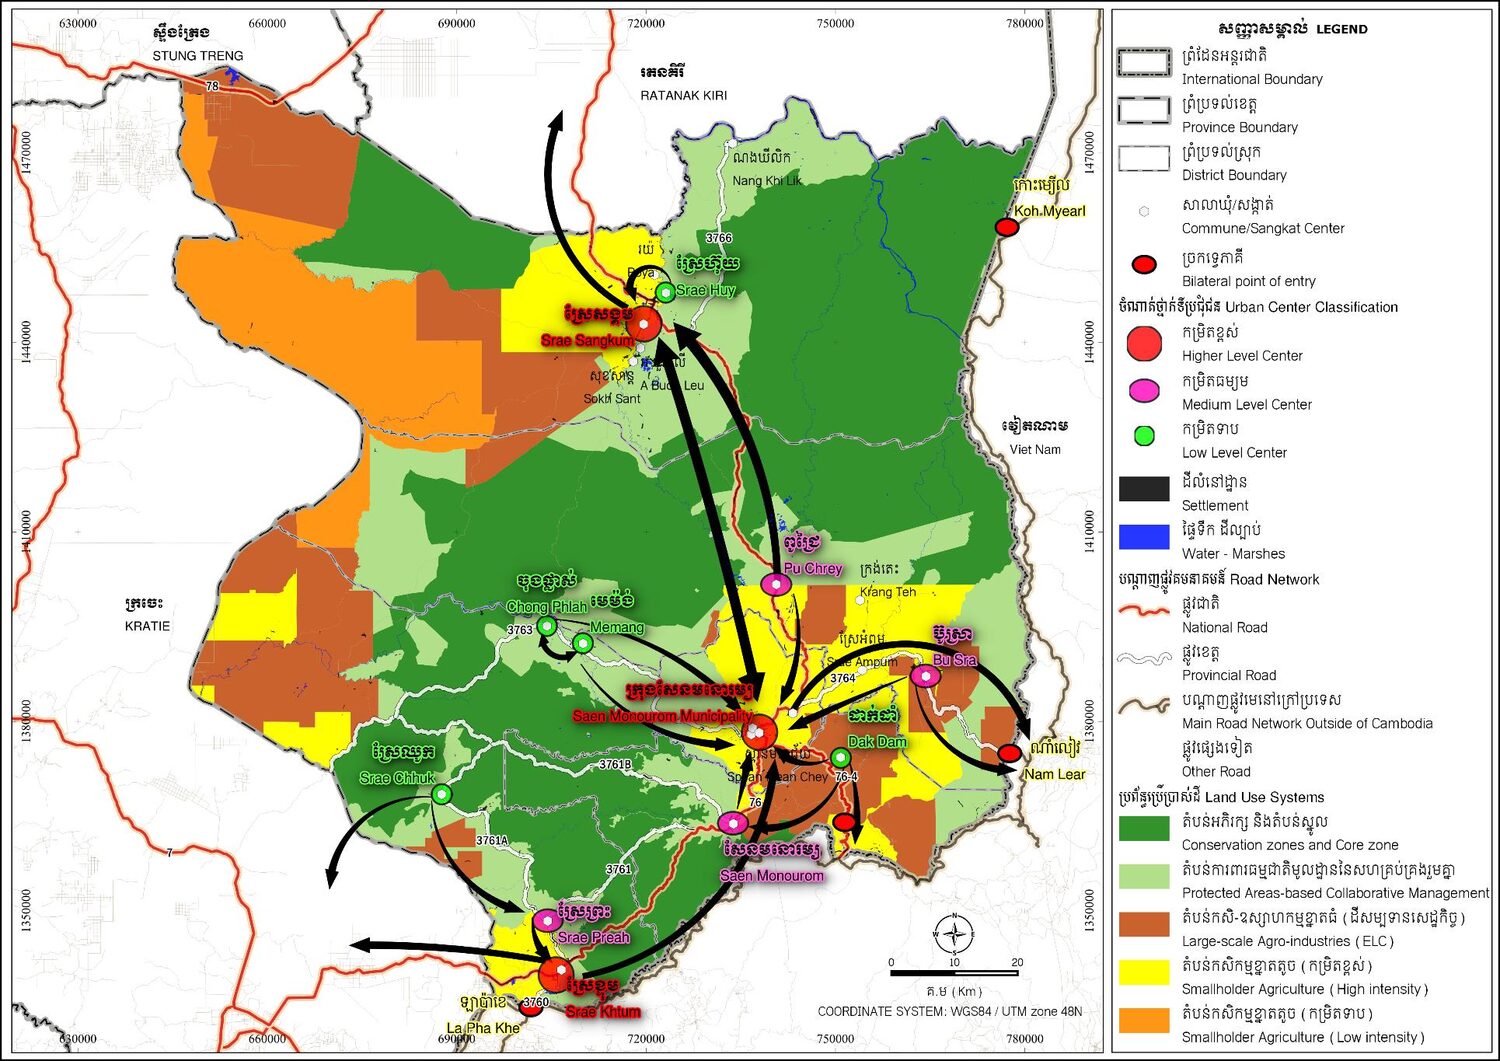
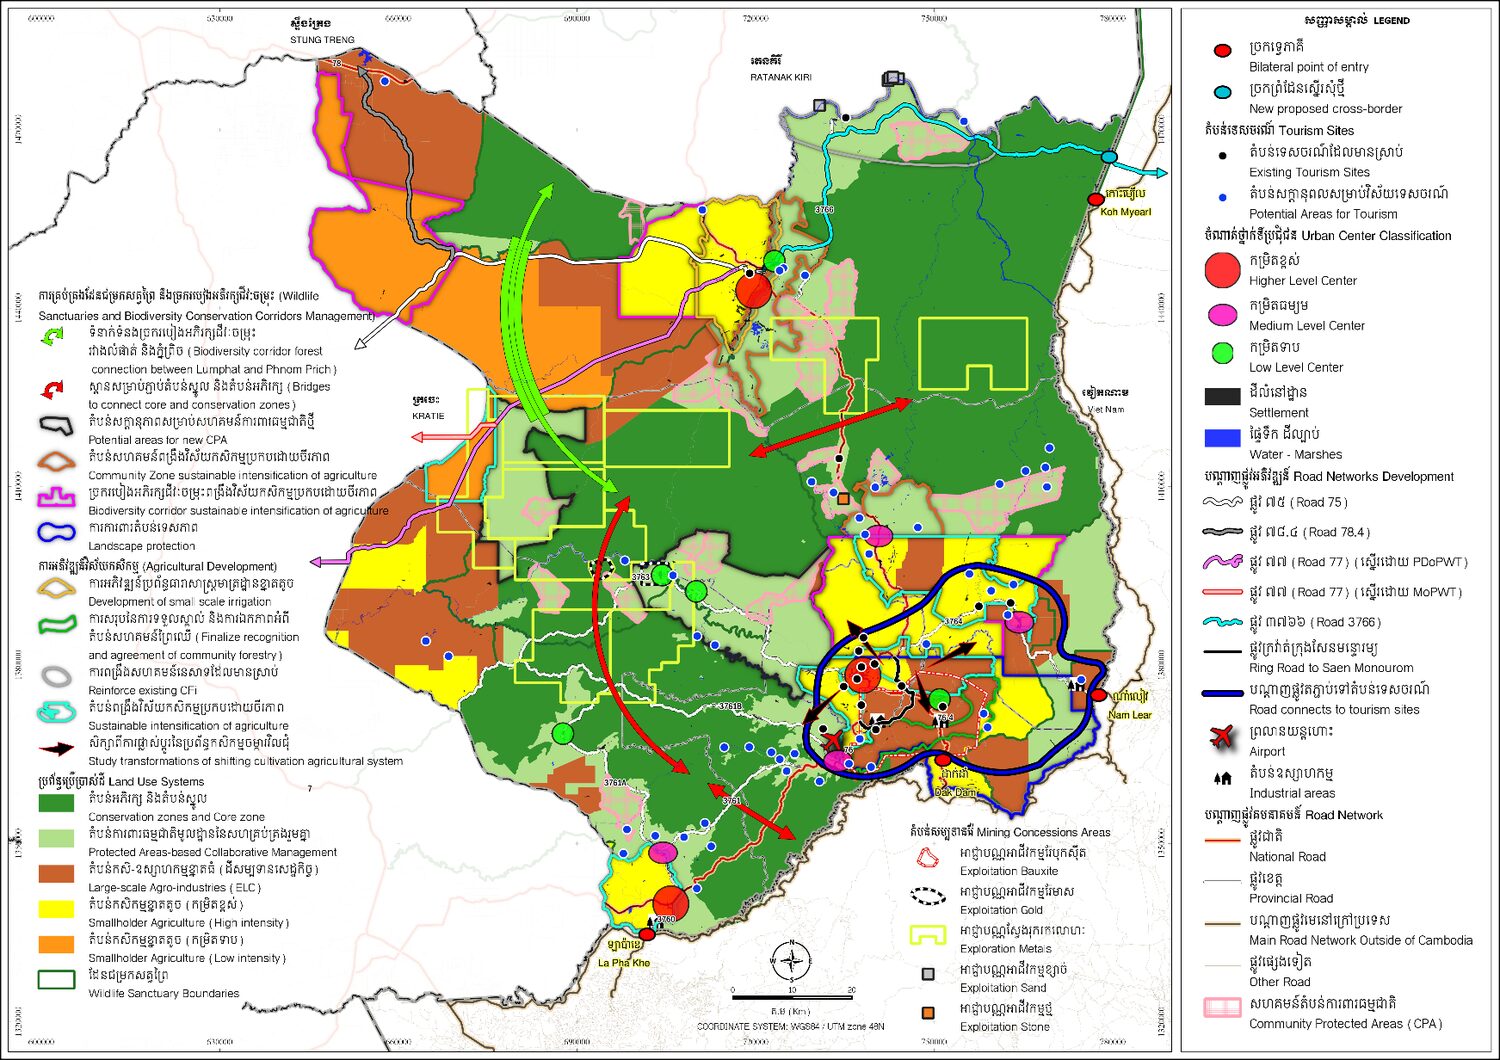
Verified · Extracted with pdfimages from Mondul Kiri Provincial Spatial Plan 2020–2040, adopted 2021, prepared for the Provincial Committee for Land Management and Urban Planning. Native resolution up to 1,990×1,407 at 220 ppi; resampled to 1,500 px and JPEG-compressed so the set totals 2.7 MB rather than 90. The ecosystem-service sheets are small in the original and have not been upscaled — enlarging them would invent detail the source does not contain. The remaining 29 sheets in the Plan duplicate features this Atlas already draws from the GIS and are not reproduced.
The provincial GIS database
The spatial data behind the Provincial Spatial Plan is published openly by WWF as a live ArcGIS feature service — 39 layers, 467 MB, licensed "No Restrictions". It is the single most important open dataset about this province, and it closes gaps this Atlas previously had to record as unfillable.
Commune growth, 2006 → 2016
Layer 4 carries what no published report does: population, area, density and a ten-year growth rate for every commune. It reframes several things this Atlas had only been able to state at district level.
| Commune | District | Pop 2006 | Pop 2016 | Growth/yr | Area km² | Density |
|---|---|---|---|---|---|---|
| Pu Chrey | Pechreada | 2,735 | 7,352 | 9.89% | 2,337.2 | 3.1 |
| Srae Huy | Kaoh Nheaek | 1,407 | 2,568 | 6.02% | 560.6 | 4.6 |
| Rummeaknea | Sen Monorom | 3,257 | 5,791 | 5.75% | 93.9 | 61.7 |
| Srae Khtum | Kaev Seima | 6,139 | 10,754 | 5.61% | 582.5 | 18.5 |
| Bu Sra | Pechreada | 3,557 | 6,040 | 5.29% | 264.3 | 22.9 |
| Srae Ampum | Pechreada | 1,044 | 1,726 | 5.03% | 177.6 | 9.7 |
| Krang Teh | Pechreada | 1,694 | 2,724 | 4.75% | 794.9 | 3.4 |
| Srae Preah | Kaev Seima | 1,493 | 2,364 | 4.60% | 666.1 | 3.5 |
| Srae Chhuk | Kaev Seima | 2,545 | 3,946 | 4.39% | 354.4 | 11.1 |
| Meaknourum | Sen Monorom | 2,292 | 3,538 | 4.34% | 182.8 | 19.4 |
| Sokhak Dom | Sen Monorom | 1,166 | 1,794 | 4.31% | 78.6 | 22.8 |
| Roya | Kaoh Nheaek | 1,768 | 2,647 | 4.04% | 2,219.1 | 1.19 |
| Sokh San | Kaoh Nheaek | 2,324 | 3,361 | 3.69% | 714.3 | 4.7 |
| Srae Sangkum | Kaoh Nheaek | 4,431 | 6,382 | 3.65% | 702.8 | 9.1 |
| Spean Mean Chey | Sen Monorom | 2,303 | 3,143 | 3.11% | 185.7 | 16.9 |
| Me Mang | Kaev Seima | 2,065 | 2,732 | 2.80% | 463.6 | 5.9 |
| Chong Phlah | Kaev Seima | 2,381 | 3,150 | 2.80% | 1,072.2 | 2.9 |
| Nang Khi Lik | Kaoh Nheaek | 2,749 | 3,623 | 2.76% | 431.6 | 8.4 |
| Saen Meaknourum (rural) | Ou Reang | 2,674 | 3,354 | 2.27% | 381.2 | 8.8 |
| A Buon Leu | Kaoh Nheaek | 1,506 | 1,814 | 1.86% | 653.9 | 2.8 |
VerifiedWWF PSP Database layer 4 (Settlement Population Growth Rate 2006–2016). Pu Chrey grew 9.89% a year — nearly tripling in a decade — while A Buon Leu managed 1.86%, the slowest, corroborating the population fall this Atlas noted from the census series. Roya is the extreme case of the province in miniature: 2,219 km² holding 2,647 people, a density of 1.19/km², against Rummeaknea's 61.7.
Mapped concessions are 35% larger than the register says
The GIS layer maps 26 ELC polygons totalling 218,883 ha — 15.3% of the province. The Spatial Plan's own annex, giving areas "after Order 01", totals 162,303 ha. That is a 56,580 ha gap. Some of it is explained by Order 01 cutbacks post-dating the mapping, but not all: Vouchisan is mapped at 20,396 ha against 10,000 ha registered, and Unigreen at 11,359 ha against 1,900 ha. Both figures come from the same planning process. Neither document reconciles them.
WWF Mondul Kiri PSP Database layer 39 (ELC, Dec 2017) vs Provincial Spatial Plan Annex 9 · our comparison
All 26 concessions listed "Ongoing"
Every concession in the December 2017 layer carries status Ongoing — none lapsed or cancelled. Administering ministry is recorded per concession: the Ministry of Agriculture holds the majority, with Coviphama, Daitanh, Master K Son, Sethey Cola and K Peace under the Ministry of Environment — i.e. sited on land the environment ministry administers.
WWF PSP Database layer 39, fields Status and Admin_Manm
A village gazetteer, at last
Layer 2 publishes 77 village centre points with Latin and Khmer names and UTM coordinates — including Andoung Kraleung and Sre Huy, the two communities profiled above. Sources are attributed per record: National Database, Researcher, CET PPWS. It is not the complete 92, and one record has null coordinates, but it is the closest thing to a public gazetteer that exists.
WWF PSP Database layer 2 (Village Centers)
What else is in there
Mining licences (Sep 2017), Land Titles (May 2017), Social Land Concessions, Community Protected Areas (Dec 2018), Protected Area and Srepok/Lumphat sanctuary zoning, the biodiversity corridor, land use, soils by Crocker classification, soil fertility, geology, contours, hydrology, power transmission lines, roads, hydro dams, international checkpoints, tourism sites, and schools and health facilities as points.
WWF Mondul Kiri Provincial Spatial Planning Database, full layer list
Mapped vs. registered concession area
Hectares, for the concessions where the two sources disagree most.
Solid = GIS polygon area (Dec 2017). Muted = Spatial Plan Annex 9, after Order 01 · Verified from both sources
Service endpoint: MDKPSPDATABASE FeatureServer · item page · owner WWF_Globil · created Dec 2018, last modified Nov 2020 · attribution: "Collected by WWF from Multiple Provincial & National Sources". Exports are available as GeoJSON, shapefile, CSV, KML, File GDB and GeoPackage.
One map, eighteen layers
Pick one base map — districts, communes, or population growth — then stack areas, lines and places on top of it. The three bases are alternative pictures of the same ground, so only one shows at a time; everything else adds. Hover or tap any shape to read what it is: every feature carries its own figures, including the measured area, protected share and mining area for each commune from the cross-layer analysis. Keyboard users can tab through the features and the readout follows focus.
Boundaries are indicative only. The line shown between Mondulkiri and Viet Nam is drawn from a simplified provincial GIS layer and does not represent the international boundary. Delimitation and demarcation of that boundary are matters for the Royal Government of Cambodia and the Government of Viet Nam; only maps published under their authority are official.ព្រំដែនដែលបង្ហាញ ជាការប្រមាណប៉ុណ្ណោះ។ ខ្សែរវាងខេត្តមណ្ឌលគិរី និងប្រទេសវៀតណាម មិនមែនជាព្រំដែនអន្តរជាតិផ្លូវការទេ។ មានតែផែនទីដែលបោះពុម្ពដោយអាជ្ញាធររដ្ឋប៉ុណ្ណោះ ដែលមានលក្ខណៈផ្លូវការ។
Hover or tap a shape to read it.
Built from provincial GIS layers 2, 5, 7, 26, 39, 41 and 44. Geometry generalised for display; figures on hover are the source's own.
The province, drawn from its own database
Every figure in this Atlas came out of the provincial GIS; these are the same layers drawn rather than counted. The geometry was pulled from the FeatureServer as GeoJSON, generalised, projected with a cosine correction for this latitude, and written as inline SVG — so they need no tile server, no API key and no network connection, and they work in the offline copy of the site.
Boundaries are indicative only. The line shown between Mondulkiri and Viet Nam is drawn from a simplified provincial GIS layer and does not represent the international boundary. Delimitation and demarcation of that boundary are matters for the Royal Government of Cambodia and the Government of Viet Nam; only maps published under their authority are official.ព្រំដែនដែលបង្ហាញ ជាការប្រមាណប៉ុណ្ណោះ។ ខ្សែរវាងខេត្តមណ្ឌលគិរី និងប្រទេសវៀតណាម មិនមែនជាព្រំដែនអន្តរជាតិផ្លូវការទេ។ មានតែផែនទីដែលបោះពុម្ពដោយអាជ្ញាធររដ្ឋប៉ុណ្ណោះ ដែលមានលក្ខណៈផ្លូវការ។
Provincial GIS layer 5, “Admin District Boundaries (2014)”, generalised to ~0.008° and projected to a local equal-aspect frame.
Boundaries are indicative only. The line shown between Mondulkiri and Viet Nam is drawn from a simplified provincial GIS layer and does not represent the international boundary. Delimitation and demarcation of that boundary are matters for the Royal Government of Cambodia and the Government of Viet Nam; only maps published under their authority are official.ព្រំដែនដែលបង្ហាញ ជាការប្រមាណប៉ុណ្ណោះ។ ខ្សែរវាងខេត្តមណ្ឌលគិរី និងប្រទេសវៀតណាម មិនមែនជាព្រំដែនអន្តរជាតិផ្លូវការទេ។ មានតែផែនទីដែលបោះពុម្ពដោយអាជ្ញាធររដ្ឋប៉ុណ្ណោះ ដែលមានលក្ខណៈផ្លូវការ។
Provincial GIS layer 44, filtered to areas touching Mondulkiri. Note Lomphat extends north into Ratanakiri.
Boundaries are indicative only. The line shown between Mondulkiri and Viet Nam is drawn from a simplified provincial GIS layer and does not represent the international boundary. Delimitation and demarcation of that boundary are matters for the Royal Government of Cambodia and the Government of Viet Nam; only maps published under their authority are official.ព្រំដែនដែលបង្ហាញ ជាការប្រមាណប៉ុណ្ណោះ។ ខ្សែរវាងខេត្តមណ្ឌលគិរី និងប្រទេសវៀតណាម មិនមែនជាព្រំដែនអន្តរជាតិផ្លូវការទេ។ មានតែផែនទីដែលបោះពុម្ពដោយអាជ្ញាធររដ្ឋប៉ុណ្ណោះ ដែលមានលក្ខណៈផ្លូវការ។
Provincial GIS layer 39, “Economic Land Concessions (Dec 2017)”, generalised to ~0.02°.
Boundaries are indicative only. The line shown between Mondulkiri and Viet Nam is drawn from a simplified provincial GIS layer and does not represent the international boundary. Delimitation and demarcation of that boundary are matters for the Royal Government of Cambodia and the Government of Viet Nam; only maps published under their authority are official.ព្រំដែនដែលបង្ហាញ ជាការប្រមាណប៉ុណ្ណោះ។ ខ្សែរវាងខេត្តមណ្ឌលគិរី និងប្រទេសវៀតណាម មិនមែនជាព្រំដែនអន្តរជាតិផ្លូវការទេ។ មានតែផែនទីដែលបោះពុម្ពដោយអាជ្ញាធររដ្ឋប៉ុណ្ណោះ ដែលមានលក្ខណៈផ្លូវការ។
Provincial GIS layer 26. Only the cleanly-digitised reaches are drawn; several rivers are stored as hundreds of disconnected fragments.
All four share one projection and one frame, so they can be read against each other: the concessions map and the protected-areas map are the same province at the same scale. Simplification is deliberate and stated — these are orientation maps, not survey documents, and should not be used to locate a boundary on the ground.
How much of this database we have actually read
The provincial GIS service publishes 39 feature layers. This Atlas has read and published all 39 — 100%. Every one has now been read. The table below is kept as the record of what was gone through, and as the place to mark any layer the service adds later.
| id | Layer | In this Atlas |
|---|---|---|
| 2 | Village Centers | ✓ published |
| 3 | Admin Commune Boundaries (2014) | ✓ published |
| 4 | Settlement Population Growth Rate (2006_2016) | ✓ published |
| 5 | Admin District Boundaries (2014) | ✓ published |
| 6 | International Check Points | ✓ published |
| 7 | Tourism Sites | ✓ published |
| 10 | Health – Referral Hospital (2008) | ✓ published |
| 11 | Health Centers (2008) | ✓ published |
| 13 | Education Pre-Schools (2012) | ✓ published |
| 14 | Education Primary Schools (2012) | ✓ published |
| 15 | Education High Schools / Lycees (2012) | ✓ published |
| 16 | Education Colleges (2012) | ✓ published |
| 17 | Settlement Areas (WWF 2017) | ✓ published |
| 19 | Power Transmission Lines (PPWS) | ✓ published |
| 20 | Power Transmission Lines (2011) | ✓ published |
| 21 | Road Line (PDPWTP 2017) | ✓ published |
| 23 | Hydro Power Dams | ✓ published |
| 24 | Hydrology Stream Names | ✓ published |
| 25 | Hydrology Stream Lines | ✓ published |
| 26 | Hydrology Major River Lines | ✓ published |
| 27 | Hydrology Major River Polygons (2016) | ✓ published |
| 29 | Contour Lines | ✓ published |
| 31 | Soils – Crocker Classification | ✓ published |
| 32 | Soils Fertility | ✓ published |
| 34 | Geology | ✓ published |
| 35 | Geology 2 | ✓ published |
| 38 | Settlement Area (WWF 2017) | ✓ published |
| 39 | Economic Land Concessions (Dec 2017) | ✓ published |
| 40 | Land Titles (May 2017) | ✓ published |
| 41 | Mining Licences (PDPE Sep 2017) | ✓ published |
| 42 | Social Land Concessions | ✓ published |
| 43 | Community Protected Areas (Dec 2018) | ✓ published |
| 44 | Protected Areas | ✓ published |
| 46 | Lumpath WS Zoning (Oct 2016) | ✓ published |
| 47 | Srepok WS Zoning (Aug 2018) | ✓ published |
| 48 | Land Use (PPWS Jan 2017) | ✓ published |
| 49 | Proposed Tiger Fence (WWF) | ✓ published |
| 50 | Biodiversity Corridor (MoE Jan 2017) | ✓ published |
| 51 | Protected Areas (MoE) | ✓ published |
| 39 of 39 layers published | 100% | |
Source: the FeatureServer's own layer index. Layer ids are not contiguous — 0, 1, 8, 9, 12, 18, 22, 28, 30, 33, 36, 37 and 45 do not exist in the service, so 39 layers span ids 2 to 51. The education and health series is now in. Nothing remains unread in this service. What is not resolved is listed in the Active data gaps: the layers whose area fields carry national rather than provincial extent, the two protected-area layers that differ by 27,279 ha once measured from geometry, and the settlement chronology that stops in 2016.
Two thirds of primary schools have fewer rooms than classes
The provincial GIS holds a record for every school in Mondulkiri, and it goes well past a dot on a map: enrolment, female enrolment, teaching staff, number of classes, number of classrooms, whether the school offers a complete primary cycle, and the principal's name and phone number. Reading the classes against the classrooms tells you something no summary statistic does.
65 of 98 schools are running shifts
Of 98 primary schools, 65 (66%) report more classes than they have classrooms — which in practice means the same room is used two or three times a day. 29 schools (30%) have one classroom or none at all. O Kle in Chong Phlas commune runs 6 classes in 2 rooms for 244 children. Building rooms and hiring teachers are different problems, and this layer separates them.
Provincial GIS layer 14, fields CLASSES and Class_ROOM, counted directly by the service.
In 40% of schools, girls are under a third of the roll
The layer records total and female enrolment separately. In 39 of 98 primary schools girls are fewer than one in three pupils. That is a distribution, not a provincial average, and it points at specific schools rather than a general claim — which is exactly what makes it actionable and also what makes it worth checking before it is quoted.
Provincial GIS layer 14, ENROL__F_ against ENROL__T_. Data vintage 2012; we have not found a newer public equivalent.
| Facility type | Count | Layer |
|---|---|---|
| Pre-schools | 30 | 13 (2012) |
| Primary schools | 98 | 14 (2012) |
| Colleges (lower secondary) | 10 | 16 (2012) |
| High schools / lycées (upper secondary) | 9 | 15 (2012) |
| Health centres | 18 | 11 (2008) |
| Referral hospital | 1 | 10 (2008) |
The ladder narrows by a factor of ten at fourteen
With the colleges layer read, every rung is now known: 30 pre-schools → 98 primary schools → 10 colleges → 9 lycées. Primary provision reaches into the villages; lower secondary does not follow it. There is one college for every 9.8 primary schools, and only nine upper-secondary schools in the entire province. Colleges are small too — Chhneng in Sre Khtum has 46 pupils across 3 classes; Sre Preah has 157. For a child in a remote commune, the distance to the nearest college is the point at which schooling usually stops, and the layer makes that geography explicit rather than leaving it as an inference from enrolment totals.
Provincial GIS layers 13, 14, 15 and 16 (2012). “College” is Cambodia's lower-secondary school, grades 7–9; “lycée” is upper secondary, grades 10–12.
Eleven primary schools for every high school. That ratio is the shape of the drop-off: primary provision reaches into the villages, secondary provision does not follow it. For a child in a remote commune the nearest lycée may be the reason schooling stops at grade six — and the distances involved are the same ones set out in the commune-to-district figures, where one Kaoh Nheaek commune sits 60 km from its own district office.
Source: Mondulkiri provincial GIS, FeatureServer layers 10, 11, 13, 14 and 15. Counts are the service's own. The education layers are dated 2012 and the health layers 2008, so these are the mapped estate as recorded then, not a current census — treat the counts as a floor.
◆ Open buffer — spatial data
Reserved for exported layers, your own GIS analysis, updated concession boundaries, or cadastral records.
Four more layers, drawn
Community agreements, the two sanctuary zoning plans, and the road network. Each was already in this Atlas as a table of figures; none had ever been drawn. A number tells you how much. A map tells you where — and in each of these four cases the where is the more useful half.
Boundaries are indicative only. The line shown between Mondulkiri and Viet Nam is drawn from a simplified provincial GIS layer and does not represent the international boundary. Delimitation and demarcation of that boundary are matters for the Royal Government of Cambodia and the Government of Viet Nam; only maps published under their authority are official.ព្រំដែនដែលបង្ហាញ ជាការប្រមាណប៉ុណ្ណោះ។ ខ្សែរវាងខេត្តមណ្ឌលគិរី និងប្រទេសវៀតណាម មិនមែនជាព្រំដែនអន្តរជាតិផ្លូវការទេ។ មានតែផែនទីដែលបោះពុម្ពដោយអាជ្ញាធររដ្ឋប៉ុណ្ណោះ ដែលមានលក្ខណៈផ្លូវការ។
The two zoning plans below are drawn on one shared colour scale, which is the only way to see what separates them. Both sanctuaries are managed by the Ministry of Environment under the same Protected Areas Law, and both plans were adopted within two years of each other. They divide the land on almost opposite principles.
Boundaries are indicative only. The line shown between Mondulkiri and Viet Nam is drawn from a simplified provincial GIS layer and does not represent the international boundary. Delimitation and demarcation of that boundary are matters for the Royal Government of Cambodia and the Government of Viet Nam; only maps published under their authority are official.ព្រំដែនដែលបង្ហាញ ជាការប្រមាណប៉ុណ្ណោះ។ ខ្សែរវាងខេត្តមណ្ឌលគិរី និងប្រទេសវៀតណាម មិនមែនជាព្រំដែនអន្តរជាតិផ្លូវការទេ។ មានតែផែនទីដែលបោះពុម្ពដោយអាជ្ញាធររដ្ឋប៉ុណ្ណោះ ដែលមានលក្ខណៈផ្លូវការ។
Boundaries are indicative only. The line shown between Mondulkiri and Viet Nam is drawn from a simplified provincial GIS layer and does not represent the international boundary. Delimitation and demarcation of that boundary are matters for the Royal Government of Cambodia and the Government of Viet Nam; only maps published under their authority are official.ព្រំដែនដែលបង្ហាញ ជាការប្រមាណប៉ុណ្ណោះ។ ខ្សែរវាងខេត្តមណ្ឌលគិរី និងប្រទេសវៀតណាម មិនមែនជាព្រំដែនអន្តរជាតិផ្លូវការទេ។ មានតែផែនទីដែលបោះពុម្ពដោយអាជ្ញាធររដ្ឋប៉ុណ្ណោះ ដែលមានលក្ខណៈផ្លូវការ។
| Zone | Srepok | Share | Lomphat | Share |
|---|---|---|---|---|
| Core — research only | 209,205 ha | 55.9% | 42,616 ha | 16.8% |
| Conservation | 52,895 ha | 14.1% | 107,034 ha | 42.1% |
| Sustainable use | 66,008 ha | 17.6% | 80,438 ha | 31.6% |
| Community — settlement allowed | 45,946 ha | 12.3% | 24,064 ha | 9.5% |
| Total | 374,053 ha | 254,152 ha |
Verified · Layers 47 and 46. Srepok locks away 55.9% of itself and opens 12.3% to settlement; Lomphat locks away 16.8% and opens 9.5%. Read together they show there is no single national answer to how much of a sanctuary people may live in — it is decided sanctuary by sanctuary, and the range is wide.
Boundaries are indicative only. The line shown between Mondulkiri and Viet Nam is drawn from a simplified provincial GIS layer and does not represent the international boundary. Delimitation and demarcation of that boundary are matters for the Royal Government of Cambodia and the Government of Viet Nam; only maps published under their authority are official.ព្រំដែនដែលបង្ហាញ ជាការប្រមាណប៉ុណ្ណោះ។ ខ្សែរវាងខេត្តមណ្ឌលគិរី និងប្រទេសវៀតណាម មិនមែនជាព្រំដែនអន្តរជាតិផ្លូវការទេ។ មានតែផែនទីដែលបោះពុម្ពដោយអាជ្ញាធររដ្ឋប៉ុណ្ណោះ ដែលមានលក្ខណៈផ្លូវការ។
What the layers say together
Every figure above this point was read out of one layer at a time. The provincial GIS never intersects its own layers, so it cannot tell you whether a mining licence sits inside a wildlife sanctuary — both boundaries are in there, but nothing compares them. This section does that comparison. It is the only part of the Atlas whose numbers exist nowhere else, which is exactly why the method comes first.
How these numbers were produced
A grid of 429,895 cells at 0.002° spacing — roughly 220 m — is laid over the province and every cell tested against every polygon by ray casting. Counting cells that fall inside two layers at once gives the overlap. Cell area is corrected for latitude, so a cell in the north is not treated as the same size as one in the south.
Calibration. Sampling is only as good as it can be shown to be. Against the source's own figures the grid returns 1,369,062 ha for the province where the district table says 1,372,090 (−0.2%), and 162,733 ha of live mining licence where the polygons themselves measure 163,586 (−0.5%). Both errors sit well inside the margin these conclusions need.
Geometry, not attributes. Measurement uses boundaries re-fetched at 0.003–0.005° resolution, not the simplified outlines drawn on the other maps in this Atlas, which are generalised for file size and under-measure small blocks by around 7%.
Read the first figure carefully. It says four fifths of the land under a live mining licence in Mondulkiri is also inside a wildlife sanctuary. It does not say four fifths of the sanctuaries are being mined — the protected estate is more than five times larger than the licensed area, and 82.4% of it carries neither a licence nor a concession. Both statements come from the same grid; they answer different questions.
Boundaries are indicative only. The line shown between Mondulkiri and Viet Nam is drawn from a simplified provincial GIS layer and does not represent the international boundary. Delimitation and demarcation of that boundary are matters for the Royal Government of Cambodia and the Government of Viet Nam; only maps published under their authority are official.ព្រំដែនដែលបង្ហាញ ជាការប្រមាណប៉ុណ្ណោះ។ ខ្សែរវាងខេត្តមណ្ឌលគិរី និងប្រទេសវៀតណាម មិនមែនជាព្រំដែនអន្តរជាតិផ្លូវការទេ។ មានតែផែនទីដែលបោះពុម្ពដោយអាជ្ញាធររដ្ឋប៉ុណ្ណោះ ដែលមានលក្ខណៈផ្លូវការ។
An attribute that disagrees with its own map
The mining layer carries a Hectares field beside each licence polygon. For ten of the twelve live licences the two agree to the decimal. For two they do not, and the gap is large enough to change a headline.
| Licence holder | Hectares field | Polygon area | Difference |
|---|---|---|---|
| RENAISSANCE — Ou Stong | 23,961 | 19,431 | +4,530 |
| RENAISSANCE — Praek Klong | 24,650 | 19,580 | +5,070 |
| The other ten live licences | 124,575 | 124,575 | exact to the decimal |
| Total, live licences | 173,186 | 163,586 | +9,601 |
Verified · Both columns come straight from layer 41: the Hectares attribute, and Shape__Area, which the server computes from the stored geometry in UTM zone 48N. Anyone quoting total live licence area as 173,186 ha is quoting a figure 5.9% larger than the licences as mapped. This Atlas uses 163,586 ha, and says why.
All 21 communes, measured
The commune boundary layer has never appeared in this Atlas before. Sampled the same way, the 21 communes total 1,371,340 ha against a provincial figure of 1,372,090 — a gap of 0.05%. That is the strongest internal check the Atlas has: two entirely separate boundary layers, digitised by different hands, agreeing to within 750 ha.
Boundaries are indicative only. The line shown between Mondulkiri and Viet Nam is drawn from a simplified provincial GIS layer and does not represent the international boundary. Delimitation and demarcation of that boundary are matters for the Royal Government of Cambodia and the Government of Viet Nam; only maps published under their authority are official.ព្រំដែនដែលបង្ហាញ ជាការប្រមាណប៉ុណ្ណោះ។ ខ្សែរវាងខេត្តមណ្ឌលគិរី និងប្រទេសវៀតណាម មិនមែនជាព្រំដែនអន្តរជាតិផ្លូវការទេ។ មានតែផែនទីដែលបោះពុម្ពដោយអាជ្ញាធររដ្ឋប៉ុណ្ណោះ ដែលមានលក្ខណៈផ្លូវការ។
| Commune | District | Hectares | Protected | Live mining (ha) |
|---|---|---|---|---|
| Pu Chrey | Pechreada | 226,042 | 88.9% | 26,496 |
| Roya | Kaoh Nheaek | 220,853 | 20.2% | 0 |
| Chong Phlah | Kaev Seima | 116,027 | 42.4% | 44,841 |
| Nang Khi Lik | Kaoh Nheaek | 101,050 | 98.5% | 0 |
| Srae Huy | Kaoh Nheaek | 82,708 | 99.6% | 0 |
| Krang Teh | Pechreada | 79,359 | 90.6% | 14,915 |
| Saen Meaknourum | Ou Reang | 78,820 | 87.8% | 1,875 |
| Sokh San | Kaoh Nheaek | 64,076 | 54.8% | 4,136 |
| Bu Sra | Pechreada | 56,856 | 52.4% | 10,776 |
| A Buon Leu | Kaoh Nheaek | 51,594 | 99.9% | 11,597 |
| Srae Chhuk | Kaev Seima | 51,323 | 99.4% | 14,907 |
| Dak Dam | Ou Reang | 46,875 | 32.7% | 16,416 |
| Srae Preah | Kaev Seima | 44,600 | 97.6% | 0 |
| Me Mang | Kaev Seima | 37,739 | 99.9% | 14,805 |
| Srae Khtum | Kaev Seima | 31,775 | 59.7% | 0 |
| Rummeaknea | Saen Meaknourum | 31,609 | 24.5% | 0 |
| Srae Ampum | Pechreada | 18,828 | 0.0% | 0 |
| Sokhak Dom | Saen Meaknourum | 15,001 | 39.1% | 0 |
| Srae Sangkum | Kaoh Nheaek | 9,046 | 1.5% | 0 |
| Spean Mean Chey | Saen Meaknourum | 5,967 | 0.0% | 0 |
| Meaknourum | Saen Meaknourum | 1,192 | 0.0% | 0 |
| Total | 1,371,340 |
Derived · Areas sampled on the 220 m grid; district names spelled as the source layer spells them. Four communes are almost entirely inside a protected area — A Buon Leu and Me Mang at 99.9%, Srae Huy 99.6%, Srae Chhuk 99.4% — which means a local land decision there is a protected-area decision by default.
Four defects in the commune layer
Recorded rather than quietly corrected, so that anyone pulling the same layer sees what we saw and can hold this account to it.
- Both communes of Ou Reang district are labelled “Saen Meaknourum”. The province has one Saen Meaknourum and it is the name of a different district. The eastern polygon — the one bordering Bu Sra that reaches 107.55°E — is Dak Dam, and is named so throughout this Atlas.
- Three names carry a leading space: “ monorom”, “ romanea”, “ Spean Mean Chey”. Sort the layer as delivered and they land above every other commune.
- Two names are lower-cased where all nineteen siblings are title-cased.
- District spellings differ between layers. The commune layer writes “Kaoh Nheaek” and “Pechreada”; the district layer writes “Kaoh Nheaek” and “Pechreada”. A join on name alone fails on two of the five districts.
Soil, tigers, and a database that sometimes means Cambodia
The last layers to be drawn, and the one that needed the most care. A service called MDKPSPDATABASE sounds like it is about Mondulkiri throughout. Some of it is about the whole country, in two different ways — and one of those ways is invisible until you add a column up.
Boundaries are indicative only. The line shown between Mondulkiri and Viet Nam is drawn from a simplified provincial GIS layer and does not represent the international boundary. Delimitation and demarcation of that boundary are matters for the Royal Government of Cambodia and the Government of Viet Nam; only maps published under their authority are official.ព្រំដែនដែលបង្ហាញ ជាការប្រមាណប៉ុណ្ណោះ។ ខ្សែរវាងខេត្តមណ្ឌលគិរី និងប្រទេសវៀតណាម មិនមែនជាព្រំដែនអន្តរជាតិផ្លូវការទេ។ មានតែផែនទីដែលបោះពុម្ពដោយអាជ្ញាធររដ្ឋប៉ុណ្ណោះ ដែលមានលក្ខណៈផ្លូវការ។
| Class | Area, from the geometry | Share | The HECTARES field |
|---|---|---|---|
| High productivity | 456,521 ha | 33.4% | 5,081,983 ha |
| Medium productivity | 75,755 ha | 5.5% | 3,523,001 ha |
| Low productivity | 834,102 ha | 61.0% | 9,325,272 ha |
| Total | 1,366,378 ha | 99.6% of the province | 17,930,256 ha |
Verified · The three polygons sit neatly inside Mondulkiri and their geometry sums to 1,366,378 ha — 99.6% of the province, which is the check that they are the right shapes. The HECTARES field beside them sums to 17,930,256 ha. Cambodia is 18,103,500 ha. The polygons were clipped to this province; the attribute was never recomputed, so it still describes the national soil map it was cut from. Anyone reading that column is reading a figure roughly thirteen times too large.
Which layers actually describe Mondulkiri
Every layer's extent was read straight from the service and compared with the province, which spans 106.33–107.61°E. The result is worth stating plainly, because nothing in the layer names warns you.
| Layer | Name | Longitude span | Scope | Condition |
|---|---|---|---|---|
| 3 | Commune boundaries | 106.33 - 107.61°E | provincial | clean |
| 32 | Soil fertility | 106.33 - 107.60°E | provincial | HECTARES field is national: sums to 17,930,256 ha, which is Cambodia |
| 34 | Geology | 106.33 - 107.60°E | provincial | clean geometry, 381 polygons |
| 41 | Mining licences | 106.49 - 107.56°E | provincial | Hectares field overstates two licences by 9,601 ha |
| 44 | Protected areas | 106.35 - 107.61°E | provincial | clean |
| 49 | Proposed tiger fence | 107.04 - 107.56°E | provincial | clean; Hectares agrees with the geometry |
| 29 | Contour lines | 102.31 - 107.65°E | NATIONAL | 190,578 lines covering all of Cambodia |
| 50 | Biodiversity corridor | 102.69 - 107.59°E | NATIONAL | 33 features; the first are named for the Cardamom Mountains |
Verified · Layer 29 holds 190,578 contour lines covering all of Cambodia, from 102.31°E to 107.65°E. Reading a maximum elevation from it gives 1,760 m — that is Phnom Aural in Kampong Speu, 300 km away. Mondulkiri's high point is Phnom Nam Lyr at just over 1,000 m. Layer 50 is national too, and its first records are named “Cooridor Cadamom” — the Cardamom Mountains, in the far south-west. This Atlas draws neither, because a national layer inside a provincial database invites exactly the error it has already caused elsewhere.
Boundaries are indicative only. The line shown between Mondulkiri and Viet Nam is drawn from a simplified provincial GIS layer and does not represent the international boundary. Delimitation and demarcation of that boundary are matters for the Royal Government of Cambodia and the Government of Viet Nam; only maps published under their authority are official.ព្រំដែនដែលបង្ហាញ ជាការប្រមាណប៉ុណ្ណោះ។ ខ្សែរវាងខេត្តមណ្ឌលគិរី និងប្រទេសវៀតណាម មិនមែនជាព្រំដែនអន្តរជាតិផ្លូវការទេ។ មានតែផែនទីដែលបោះពុម្ពដោយអាជ្ញាធររដ្ឋប៉ុណ្ណោះ ដែលមានលក្ខណៈផ្លូវការ។
The map record
Three official government map sheets covering the province. Each is described below so the record stands on its own; add the image files to images/maps/ to have them render in place.
Land Use & Natural Resources of Mondulkiri
mondulkiri-landuse.jpg into images/maps/ to reproduce it here.
Royal Government of Cambodia · uploaded by the site owner
Hot Spot Map of Mondulkiri (sheet 11)
mondulkiri-hotspot.jpg into images/maps/ to reproduce it here.
Ministry of Land Management, Urban Planning & Construction / Danida-DFID, 2004
Administrative Map of Mondulkiri (sheet 11)
mondulkiri-admin.jpg into images/maps/ to reproduce it here.
MLMUPC / Danida-DFID · Relevant to data gap #1
◆ Open buffer — further map sheets
Reserved for cadastral sheets, commune maps, ELC boundary plans, forest-cover time series, or GIS exports. Include scale, datum and year with each so it can be cited.
DerivedVerified Geometry recovered from this Atlas’s own drawings by inverting the shared projection; tourism coordinates as published by the Visitor Guide’s planner. Descriptions are the Atlas’s own, at the tier each already carried.
Take the whole province into Google Earth
Google Earth Pro is a desktop program, so it cannot be put inside a web page and nothing here pretends otherwise. What it reads is KML, and this Atlas can produce it. Every map on this site is drawn on one frame and one projection, and that projection is a plain affine map from longitude and latitude to drawing units — which inverts exactly. So the 621 features already drawn here can be read back off the drawings as real coordinates: every commune, every unbuilt dam, every mining licence, every school, every sanctuary zone, each carrying the sentence this Atlas already wrote about it.
How accurate this is, stated rather than implied. The recovery was checked against the one layer where true coordinates were already in hand — the provincial GIS hydropower layer, thirteen sites. It agrees to a mean of 8 m and a maximum of 13 m. The drawings round to a tenth of a unit, which puts a floor of about 19 m under anything here. That is right for seeing what is where, and wrong for anything that turns on a boundary: do not survey off it, and do not read the provincial or international lines as authoritative.
| Layer | Size | File |
|---|---|---|
| Every layer, one fileAll 621 features as folders. Start here. | 48.9 KB | Download .kmz |
| AdministrationFive districts, twenty-one communes and the 77 village centres the map layer holds. | 10.8 KB | Download .kmz |
| Protected areasSanctuary boundaries, their management zones, and the community areas inside them. | 15.2 KB | Download .kmz |
| Land and concessionsEconomic land concessions, indigenous communal titles, and every recorded cut. | 3.0 KB | Download .kmz |
| Mining licencesThe provincial licence layer: valid, invalid and not yet granted. | 2.3 KB | Download .kmz |
| EnergyThirteen hydropower sites, none built, and the transmission line. | 1.7 KB | Download .kmz |
| Roads, rivers and crossingsNational and provincial roads, rivers, and the four border gates. | 4.7 KB | Download .kmz |
| Schools and healthEvery mapped school and health facility, and the distance-to-services layer. | 5.3 KB | Download .kmz |
| Soil and populationSoil classes, and population change by commune 2006 to 2016. | 11.4 KB | Download .kmz |
| Tourism sitesThe 29 sites the Visitor Guide plans routes to, at their true coordinates. | 1.7 KB | Download .kmz |
105 KB in total, carried inside this page rather than fetched, so the downloads work from a folder with no server and no connection. Open a .kmz by double-clicking it, or in Google Earth Pro use File → Open. Each file arrives as a folder tree you can switch on and off a layer at a time.
Mondulkiri from above
Sen Monorom at the centre, the plateau around it, and the forest the rest of this Atlas measures.
Nothing is requested from Google until you press this. The imagery, and the boundaries drawn on it, are Google’s and not authoritative — see the notice under every map on this site.
Open buffer — Google Earth. Reserved for the source GIS shapefiles if the province releases them, in which case these recovered geometries should be replaced rather than reconciled.
Every layer, and what became of it
The provincial FeatureServer publishes 39 layers. All 39 have been read. Most are drawn. A few are deliberately not, and a few simply add little at provincial scale — this table says which is which, so the question does not have to be asked again.
| State | Layers | Where they are |
|---|---|---|
| Mapped | 19 static maps and 18 interactive layers from layers 2, 3, 5, 7, 21, 26, 32, 39, 40, 41, 42, 43, 44, 46, 47, 48, 49, plus 10–16 and 20 as facilities | Across the GIS database, More layers, Growth & tenure, Services & access and Soil & audit |
| Computed | Layers 3, 39, 41, 44 recombined into overlaps the GIS never performs; layer 2 against 10–16 for distance to services | Cross-layer analysis and distance to care |
| Withheld | 29 contour lines and 50 biodiversity corridor | Both span 102°E to 107°E — the whole country. Drawing a national layer inside a provincial atlas invites the error it has already caused elsewhere. Documented in the extent audit instead. |
| Read, not drawn | 34, 35 geology · 31 Crocker soils · 25, 27 streams and river polygons · 17, 38 settlement areas · 6 border checkpoints · 23 hydro dams · 19 PPWS power line · 4 settlement growth attributes · 51 MoE protected areas | Their figures are used across the Atlas, but none earns a map at 1:700,000. The geology layer was tested properly rather than assumed: its extent is genuinely provincial (106.333–107.604°E, matching the province almost exactly), but its AREA attribute is national-scale — the “Water” record alone claims 1.72 million ha, larger than the province — and its 381 polygons fragment so finely that at the generalisation a page needs, most collapse to zero-area slivers. Only three units (Quaternary, Triassic and Lower–Middle Jurassic) survive as drawable shapes, so a geology map here would show three of nine eras while implying it showed all of them. The stream network is denser than the page can carry; settlement areas duplicate layers already drawn. Say the word and any of them gets one. |
Verified · Service: MDKPSPDATABASE FeatureServer, 467 MB, licensed “No Restrictions”, owner WWF_Globil. The nine geological eras present are Ante-Cambrian, Devonian–Carboniferous, Permian, Triassic, Lower–Middle Jurassic, Jurassic–Cretaceous, Prior-Quaternary, Quaternary, and one recorded as unknown.
Which figure should I use?
Contested This Atlas publishes competing figures rather than picking one quietly. That is the right call for a public record and a nuisance if you have landed mid-page on one number and do not know a rival exists. Every contested pair on the site is resolved here, once.
| Quantity | Figure A | Figure B | Which to use, and why |
|---|---|---|---|
| Provincial area | 1,428,800 haMinistry of Interior | 1,372,090 haGIS, measured | Use 1,428,800 ha for anything official or legal — it is the administrative figure the Plan itself cites. Use 1,372,090 ha when you are computing shares from the mapped geometry, because that is what the polygons actually add up to. The 56,710 ha gap is between a declared area and a measured one, and the Spatial Plan reproduces both without reconciling them. |
| Population, 2019 | 92,213NIS census | 90,949Commune Database / PDoP | Use 92,213 unless you are working inside the Spatial Plan’s own tables, which are built on 90,949. Two official counts of the same year, 1,264 apart; neither has been withdrawn. |
| Villages | 92Spatial Plan | 90Ministry of Interior | Use 90 for the administrative count. The Plan says 92. Separately, the GIS holds only 77 village-centre points, so any distance calculation on this site covers 77 villages and not the full set — which is why the thirteen missing points are recorded as an open gap. |
| Protected-area boundaries | Layer 44current | Layer 511993/2002 | Use layer 44. Layer 51 is the original designations, not a rival survey — see the vintages panel, which also corrects a figure this Atlas used to publish. |
| Mining footprint | 213,531 haPlan register, 2021 | 163,586 haGIS polygons, 2017 | Different instruments, different dates, four years apart. Quote the date with the number or do not quote it at all. |
| Tourism attraction sites | 15 recognised, 29 mappedSpatial Plan text, and its own GIS layer 7 | 106 attractionsDeputy provincial governor, Feb 2025 | Depends what you are doing. 15 is the only count with an operator attached to each site, so use it if you need to know who you would be paying. 29 is the only count with coordinates, so use it for anything spatial. 106 has no published definition and no register behind it; quote it as a claim about potential, never as an inventory. All three, side by side. |
The Atlas checks itself
This site keeps insisting that a figure is only as good as the check you can run on it. That is easy to write and easy to ignore, so the checks run here, in front of you, when the page loads. Each one states a claim, recomputes both sides from the dataset, and reports the gap. Several disagree — and those are the most useful rows, because they are how the errors elsewhere in this Atlas were found.
The checks run in your browser. If you are reading this line, JavaScript is off — the findings are still written out in Cross-layer analysis and Soil and audit.
Active data gaps
Cross-referencing across government, multilateral and independent databases still leaves these voids. They are listed rather than papered over — a register that hides its own holes is not a register. If you hold any of this data, the Public Verification Module is the route in.
- Thirteen villages have no mapped centre. The province records 90 villages; the GIS village-centre layer holds 77 points, now drawn on the map. The missing thirteen cannot be placed at all from this database, which matters for any question that starts “how far is the nearest…”.
- Village-level census stratification. Partly closed. WWF's GIS database now gives 77 named village centre points with coordinates — but still no population figures per village, and 77 of 92, not the full set. The 2019 NIS microdata continues to withhold disaggregated village tables.
- Cadastral overlap contradictions. Sharpened, not resolved. The GIS concession layer maps 218,883 ha against the register's 162,303 ha — a 56,580 ha gap, now quantified rather than merely suspected. Exact coordinates of community land excised under Order 01 remain unpublished, which is precisely what would explain the difference.
- Cross-border trade granularity. The General Department of Customs and Excise publishes national import/export data, but localised volumes through the Bu Prang crossing — linking Tuy Duc district, Đắk Nông to Ou Reang — are restricted, obscuring the province's true agricultural export footprint to Vietnam.
- Hydropower. Closed, and our own count corrected. This entry used to say eleven Mondulkiri dam sites, 104 MW. That came from the layer’s province field. Tested against the district polygons there are thirteen sites and 114 MW: Prek Rwei II and Prek Chbar are filed under Ratanak Kiri but sit 9.3 km and 11.6 km inside Kaoh Nheaek. None of the thirteen is built. What remains unknown is whether anything changed after the record’s June 2015 update: no developer, financier or EIA is named for any of them, and we found no public source that supersedes the layer.
- Utility micro-grids. Sharpened. Household electrification figures separating EAC-metered grid connections from off-grid solar remain missing at commune level; the province-wide 14,120 connected households is still all that is public. The GIS cannot help: its two main transmission segments carry no voltage, status or owner at all, and the only line with a stated voltage is a 115 kV proposal that has been “Under Study” since 2011.
- Mining extraction footprint. Largely closed. The licence boundary layer has now been fully transcribed: 27 polygons, of which 12 are live and cover 173,186 ha — 12.1% of the province. What remains genuinely undisclosed is exploited hectare coverage as against licensed area, and licence activity after the layer's September 2017 date — partly closed: ODC's national register carries a status line dated 23 March 2020 for Renaissance Minerals at O'Ktung in Keo Seima, and names 43 records against the GIS's 27. What is still missing is a current live-licence boundary file. The 173,186 ha GIS figure and the 213,531 ha register total of January 2021 also remain unreconciled — different instruments, different dates.
- Provincial budget, FY2026. Recurrent expenditure for 2026 is aggregated inside the national framework rather than published as a provincial line, so only the FY2025 figure (37,862M riel) can be stated with confidence.
- Social Land Concessions have no attributes at all. The provincial GIS carries exactly two Social Land Concession polygons, measuring 2,606 ha and 2,002 ha (4,608 ha together) — and the layer holds no name, date, district, beneficiary count or implementing programme. Two shapes and nothing else. Given that a Social Land Concession exists specifically to give landless families title, the absence of any beneficiary record is the most consequential blank in the entire database.
- Which protected-area figure is right. Largely closed, and our own figure corrected. This entry used to say the two layers disagree by 78,120 ha. That total was read off their hectare fields. Measured from the polygons the difference is 27,279 ha, because one record — Mondul Kiri Protected Forest — states an area 14.2% larger than its own geometry. Layer 51 is also not a rival survey but the 1993 and 2002 designations, which is why nothing adjudicates between them: they describe different decades. Until a current MoE boundary file with a stated date is published, every protected-area figure on this site should be read as “according to layer 44”.
- Sanctuary zoning — now one gap, not three. Largely closed. The GIS yields full four-zone plans for Phnom Prich (222,090 ha), Srepok (374,053 ha) and Lomphat (254,152 ha). What remains missing is Keo Seima — 293,993 ha, the province's second-largest protected area and the one with the most people living in it — which has no zoning layer in this database at all. Phnom Namlear (45,900 ha) is likewise unzoned here.
- Srepok's proposed CPAs. One 15,347 ha Sustainable Use block in Srepok is flagged “Proposed to establish CPAs” in the source layer. Whether that proposal was ever decided — and if so, in whose favour — is not recorded anywhere public we can find.
- Communal land title dates and areas. Partly closed. Seven titled indigenous communities are now named with parcel counts. Missing: the MLMUPC certificate number, date of issue, and total hectares for each — so it remains impossible to say how much land is under communal title province-wide, or how long each community waited. Closed, with one instrument outstanding. The registry now gives the areas: 5,728.9 ha across eight titles held by at least 497 families — and eight, not the seven this Atlas was counting. Two of the three sub-decrees that released land can be traced to a registered title exact to the hectare; Sub-decree 62's 711.31 ha for 72 families cannot be traced to any title in any province. What is still missing is the MLMUPC certificate number and date for each. The sub-decree chronology dates and sizes three of the grants at source — Sub-decrees 62 (711.31 ha, 72 families), 239 (358.51 ha, 31 families) and 250 (512.42 ha, 93 families), all cut from Seima between February and May 2013. That is the land released for communal title, which is not the same as the certificate finally issued, so the gap stays open until MLMUPC publishes the titles themselves.
- Andoung Kra Leung's geocode. One of the seven titled communities carries a blank village geocode in the land-title layer, so it cannot be placed in a district from this source. A small error, but it is the kind that quietly propagates once copied.
- No published 2025 provincial arrival figures. The series here stops at 2024, and the most recent monthly figure is January 2024. The provincial tourism department clearly compiles arrivals monthly — the numbers surface in press reporting — but nothing is published as a dataset, so the Atlas cannot carry a current year.
- No register behind the 106 attractions. The province's own headline count of its tourism assets exists only as a spoken figure. There is no list, no map, no definition of what qualifies. Ten of the 29 mapped sites still have no English name.
- Foreign arrivals are not broken down. Roughly 6,000 foreign visitors in 2024 is the whole of what is published — no nationality split, no length of stay, no spend. The Master Plan's revenue target cannot be tested against anything.
- Site distances. Largely closed, by derivation. Only three of the 29 mapped sites carry a distance from Sen Monorom in any official document. Inverting the projection the provincial GIS map was drawn with now gives coordinates, a straight-line distance and a compass bearing for all twenty-nine, checked against four towns of known position. Road distances for the other 26 remain estimates at a factor of 1.55, and the underlying gap is unchanged: no authority publishes road distances, entrance fees or opening hours for the province’s own attractions.
- Twenty-six of twenty-nine sites have no published distance. Only Bou Sra, Phnom Doh Kromom and Phnom Kroul carry a distance from Sen Monorom in an official document. Guidebook figures for the rest contradict each other, so the Visitor Guide prints none of them.
◆ Open space — drop your remaining data here
This block is deliberately empty and is yours to fill. Paste in unmentioned personal data, internal spreadsheets, field notes, scanned decrees, commune-level tables, photographs, or anything that has no home yet — directly inside the comment block above.
Matching buffers are already placed in: Economy (macro-investment card), Law & Land (legal register row buffer), and Community Hub (directory and ledger). Search any file for INSERT ADDITIONAL to find every injection point.
The 2026 list: seventeen things that are not published
This section is the one this Atlas is least willing to let go stale, because a gap list that is itself out of date is worse than none. Everything below was checked in August 2026. Several of these are not obscure — they are the ordinary statistical furniture of a province, and they are missing.
| What is missing | What is actually the case |
|---|---|
| A provincial volume of the 2024 survey | The Inter-Censal Population Survey says at section 1.6 that a capital and provincial results report would be produced for every province, analysed in 2025 and published in the second quarter of that year. As of August 2026 it does not exist — fourteen months late. Nor do the eighteen promised thematic reports, two of which (population projections to 2050, and ethnic minorities) would matter here more than almost anywhere. Verified |
| Mondulkiri in the sub-national statistics series | The statistics institute publishes a sub-national report series covering about twenty provinces. Mondulkiri is not one of them. Verified |
| A statistical yearbook after 2021 | Only the 2017 and 2021 editions are published. Verified |
| A census plan for 2029 | No decree, sub-decree, announcement or budget line for the next census appears anywhere in the public record. Verified |
| The province's own 2026 budget | The Ministry of Economy and Finance's Budget in Brief for 2026 does not contain the word Mondulkiri. Sub-national budgeting is published in aggregate only: 6,686 billion riel of current expenditure across every province, and a note that this excludes the provincial health department and district education office packages. The province's own line is unpublished. Verified |
| Commune-level anything, since 2010 | The commune database is the obvious source for poverty, water access, roads and migration at commune level. Its public interface offers 2008, 2009 and 2010. The current system moved to the statistics institute and requires a login. The newest openly downloadable commune indicators for this province are sixteen years old. Verified |
| Mondulkiri in the socio-economic survey | The 2023 survey samples by province and reports by five zones. Mondulkiri appears twice in the whole document: once defining the Plateau and Mountain stratum, once in the sample allocation table. There is not a single Mondulkiri estimate in it. Verified |
| A poverty rate for this province | No current published figures for the identification-of-poor programme at province or commune level. The multidimensional poverty index has no Mondulkiri domain — the underlying survey groups it with Ratanak Kiri. Verified |
| An official forest cover figure | None, at any recent date, from the Forestry Administration or the environment ministry. The national series still rests on the 2010 assessment. Every provincial forest number on this page is satellite-derived. Verified |
| Provincial health statistics after 2017 | The annual health statistics report carried provincial annexes until 2016/2017 and then stopped. Everything since sits inside the health information system behind a login. Verified |
| School and enrolment counts after 2021/22 | The education ministry's statistics portal is unreachable to any automated client and its certificate has expired. The newest openly catalogued provincial school data is from 2012/13. Verified |
| Crop areas from the agriculture survey | The 2024 agriculture survey mentions Mondulkiri exactly once in 167 pages, in the sampling frame. It gives the province 14,672 agricultural holdings — a genuinely new official figure, and about 77% of all households — and then publishes every result at national and zone level only. With 211 sampled holdings, a provincial estimate would not have been publishable anyway. Verified |
| The agriculture ministry's own annual report | Not published openly in any repository. This is why the agriculture figures on this site come from the interior ministry's provincial information book rather than from the sector ministry. Verified |
| Any observed climate series | The water resources and meteorology ministry publishes no station records, no monthly series and no provincial normals, and has no open data portal. Every temperature and rainfall figure available for this province is modelled or reanalysis, not observed. Verified |
| Provincial electrification and telecoms statistics | Neither the electricity authority beyond its village count, nor the telecommunications regulator, publishes province-level subscriber, coverage or tower data. Verified |
| An update to the Spatial Plan | Nothing since the 2020–2040 plan. Verified |
| Open access to the forest data itself | The global forest watch programmatic interface now requires an API key and refuses anonymous requests, which closes the route this kind of page used to rely on. The series survives only because a Cambodian open-data platform mirrors the files. Reported |
The pattern across seventeen entries is worth naming, because it is not simple neglect. National statistics for Cambodia are in good order and improving; the 2024 survey is a serious piece of work. What is missing is almost entirely the provincial cut of it — the volume promised and not delivered, the survey that samples here and reports elsewhere, the database that went behind a login, the ministry annex that stopped in 2017. A reader wanting to know about Cambodia is well served. A reader wanting to know about Mondulkiri is reading satellite data and a 2019 census, which is exactly why this Atlas exists and exactly what it cannot fix.
The map record
This Atlas draws its own maps. Every one is built from the provincial GIS and written straight into the page as SVG, so they need no map service, no access token and no internet connection — they render in the offline copy of this site exactly as they do here.
There is one interactive map with seven toggleable layers, where hovering, tapping or tabbing onto any shape reports what it is and what is known about it, and seven fixed thematic maps covering districts, the protected estate, concessions, rivers, mining licences, Phnom Prich zoning and village centres. All share one projection and one frame, so any of them can be read against any other.
Social Services & Public Safety
Provincial Referral Hospital
Mondulkiri Provincial Referral Hospital, in Cham Bak village, Sen Monorom, is the province's main public general hospital, with neonatal care and outreach to surrounding communities. A new ophthalmology building (~$90,000 USD) was inaugurated in January 2024.
Ministry of Health facility records; Construction & Property News, Jan 2024
Health Centers
The Sen Monorom Operational District covers 12 health centers across the province, including the Sen Monorom, Rokar, and Pechreada health centers. For anything beyond routine care, the Provincial Referral Hospital or a private clinic in Sen Monorom is the usual next step — serious cases are often transferred toward Phnom Penh.
Ministry of Health operational district records
Schools & Education
Primary and secondary public schools serve Sen Monorom and each district town, with smaller primary schools in larger communes. Bunong-language and bilingual education initiatives exist in some indigenous communities but coverage is uneven — this is an area we're actively verifying with the Provincial Office of Education.
Under verification — Provincial Office of Education
Emergency Contacts
Police: 117 · Fire: 118 · Ambulance: 119 (national numbers). English-speaking police line: +855 12 999 999. Response times outside Sen Monorom town can be significantly longer — for remote treks, carry a local guide's contact and know the nearest health center before you set out.
Telecommunication Regulator of Cambodia (TRC)